Rebot
Web based MVP for optimizing pricing & reporting with AI.
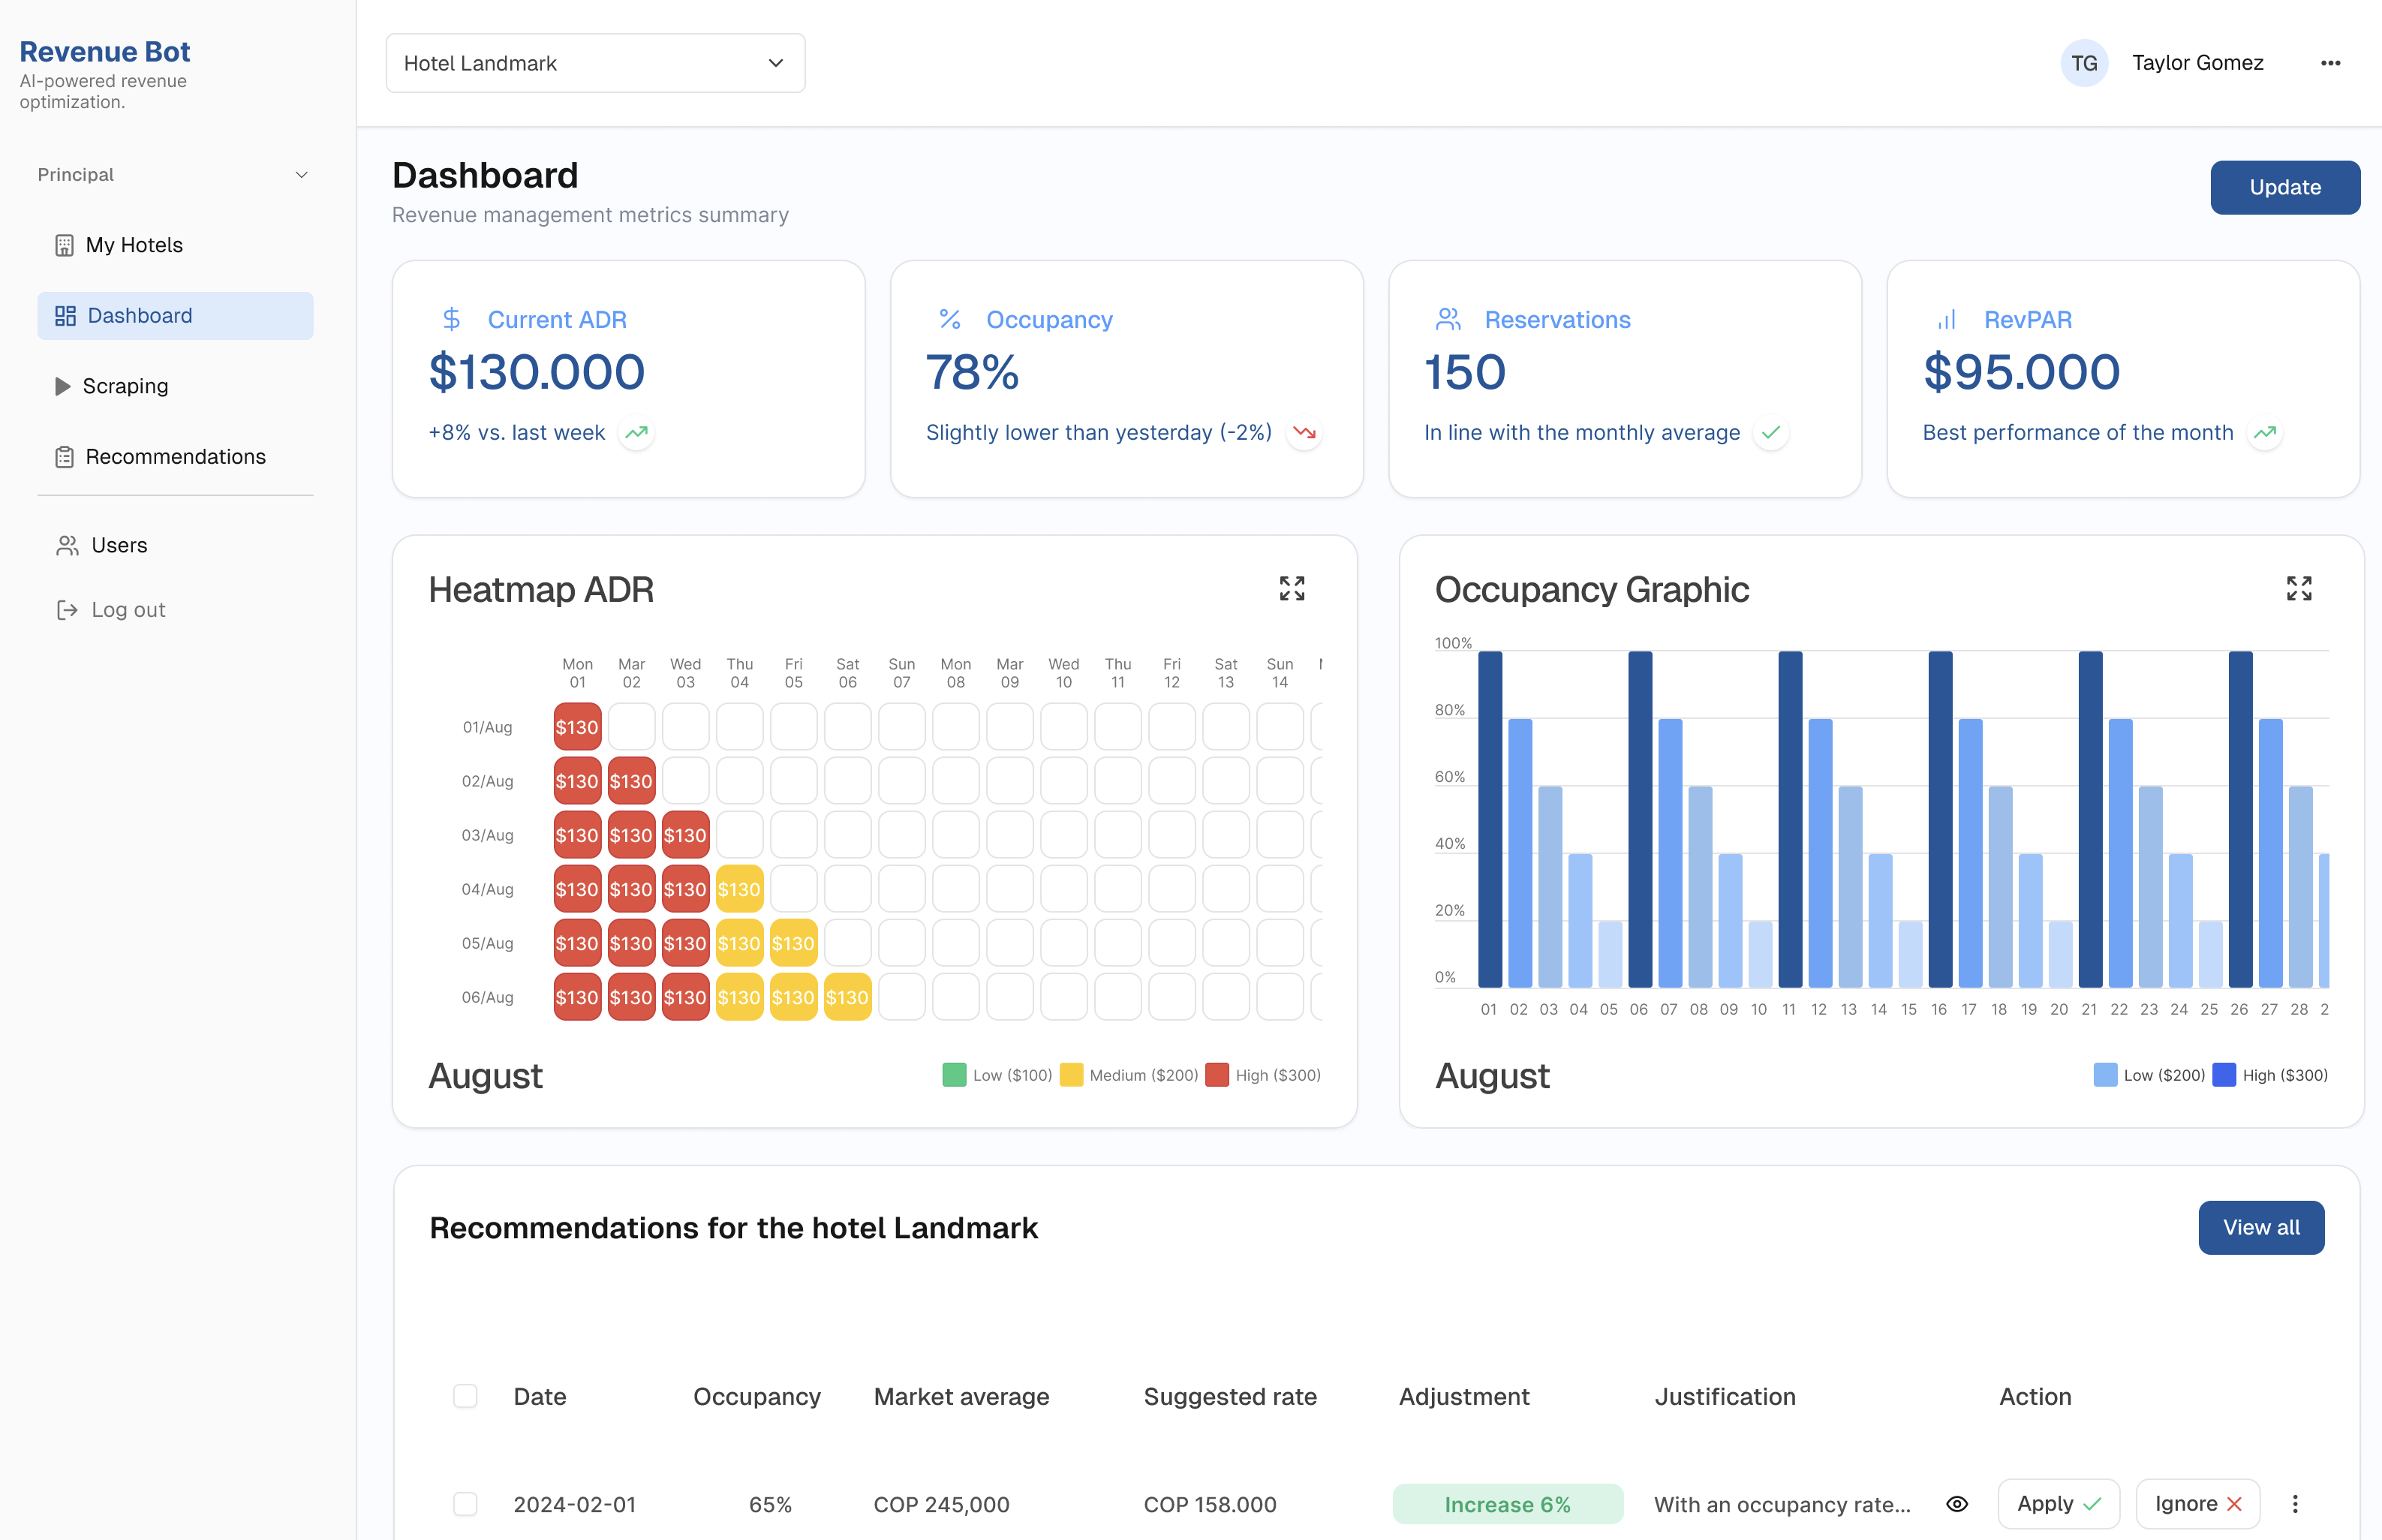
In this project, I designed a responsive web app that helps hotel managers make smarter pricing decisions.
The tool integrates real-time competitor data, AI-generated recommendations, and intuitive dashboards turning complex revenue management into something clear, scalable and actionable.
The problem
Revenue managers spend up to 4 hours per hotel each week tracking competitor prices across 30 days, limiting updates to weekly. This makes it nearly impossible to scale beyond 2–3 hotels per day. Without dynamic pricing, hotels can lose 5–10% of potential revenue
The solution
We designed an AI Revenue web to centralize and automate revenue management:
With Rebot, revenue managers reduced manual benchmarking from hours per hotel to an automated daily process. Instead of checking prices for only 2–3 hotels per day, they can now monitor 100+ hotels simultaneously, with AI scraping generated in <10 seconds. This efficiency unlocks up to 5–10% additional revenue through dynamic pricing.
Heatmap
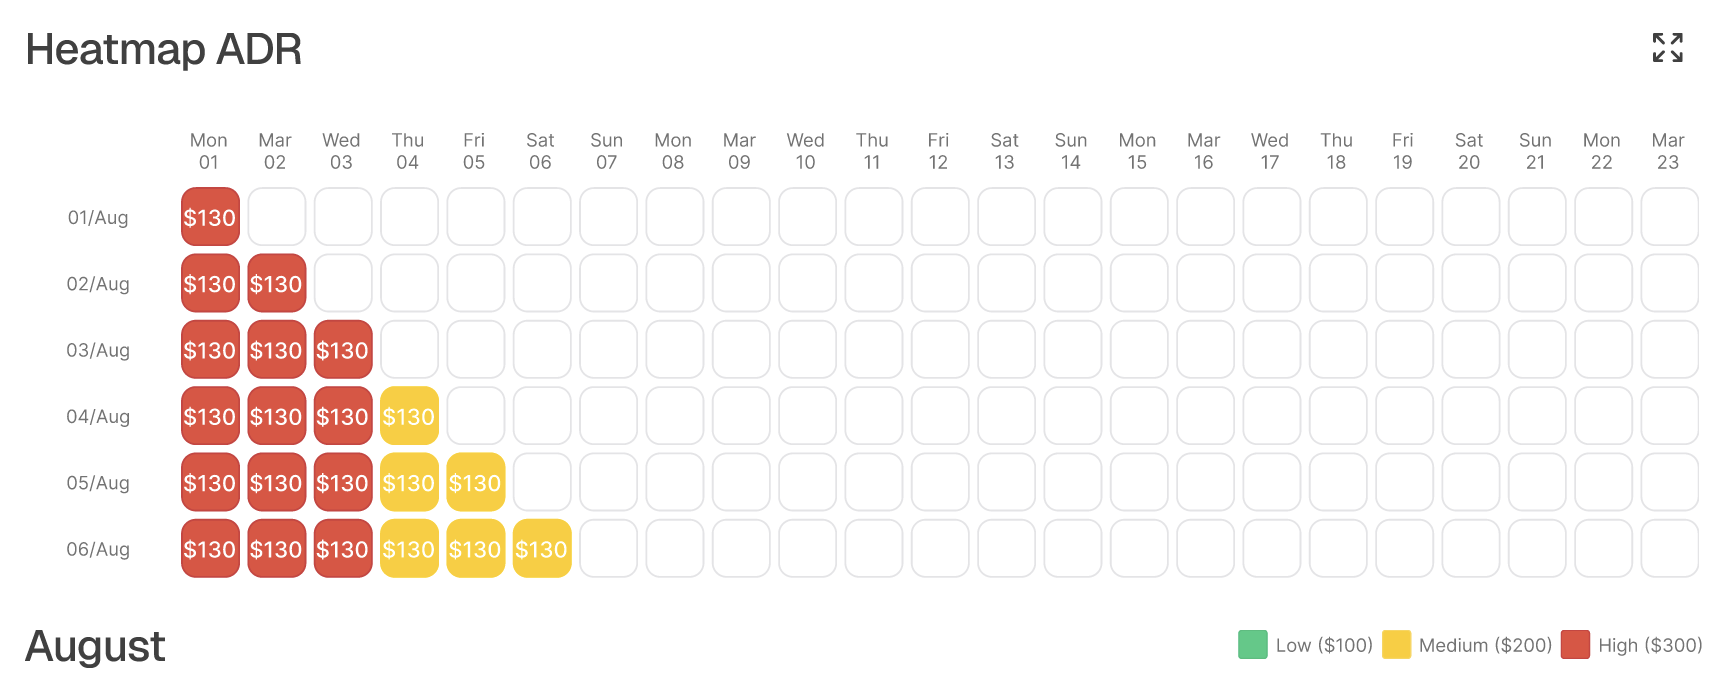
Traditional heatmaps are common tools for revenue managers, but they’re often overwhelming, packed with dense grids, endless rows of dates, and heavy colors. While they show a lot of data, they make it difficult to scan quickly or spot meaningful patterns.
Scraper
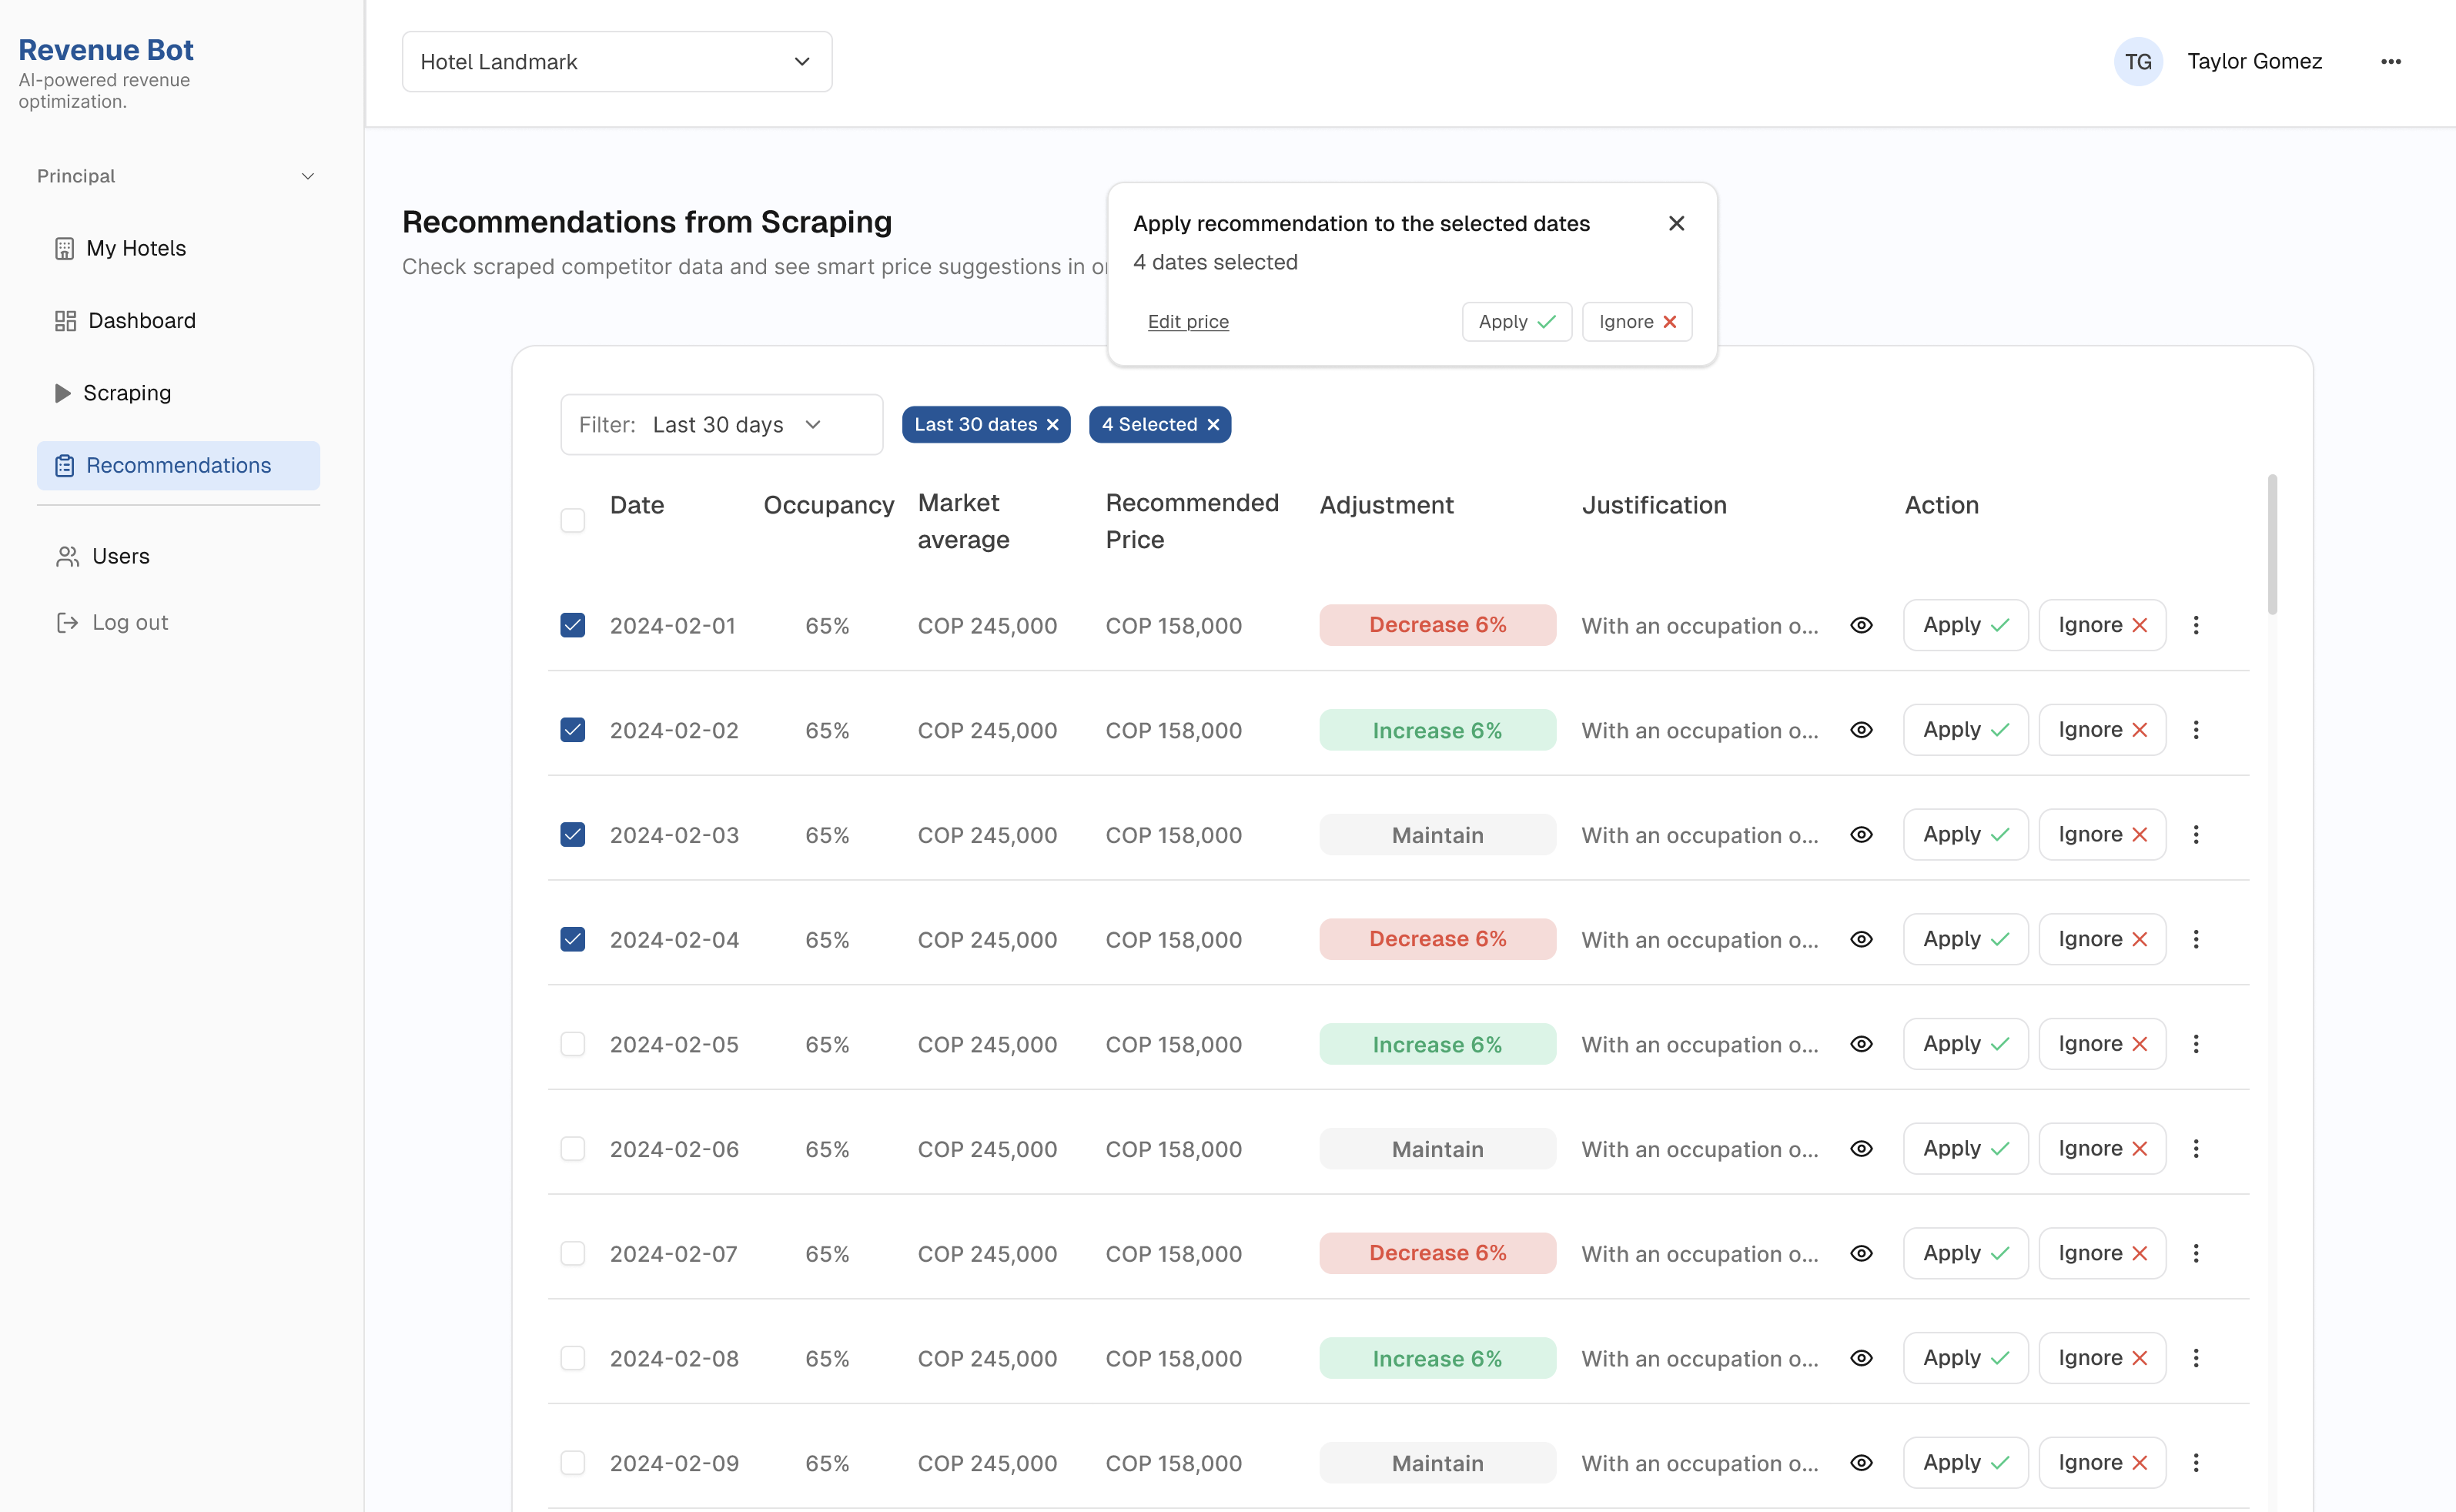
Revenue managers waste hours tracking competitors prices manually, so working with the dev-built scraper helped me understand how this tool could solve this problem for the user and translate it into a clear, actionable table.
The Design Process
I approached this project with a design thinking mindset, starting with real user pain points, validating needs quickly, and iterating fast. Along the way, I used AI as a partner to question assumptions, explore ideas, and speed up smaller decisions.
Understand
Define
• Problem statement• Business goals
Ideate
• Fast wireframes to validate ideas • AI-powered flows: scraping, PMS sync, smart pricing • Familiar UI for managers
Build & Iterate
• Iterated based on real feedback• Reduced visual noise• Clear hierarchy
Implement
• Dev team building the MVP• Internal testing in progress• Next step: test with real revenue managers!


Design Iterations
This example is one of the iterations that shows how the design evolved, starting simple in low-fi, testing actions in the first design, and refining into a clearer final version.
First Version
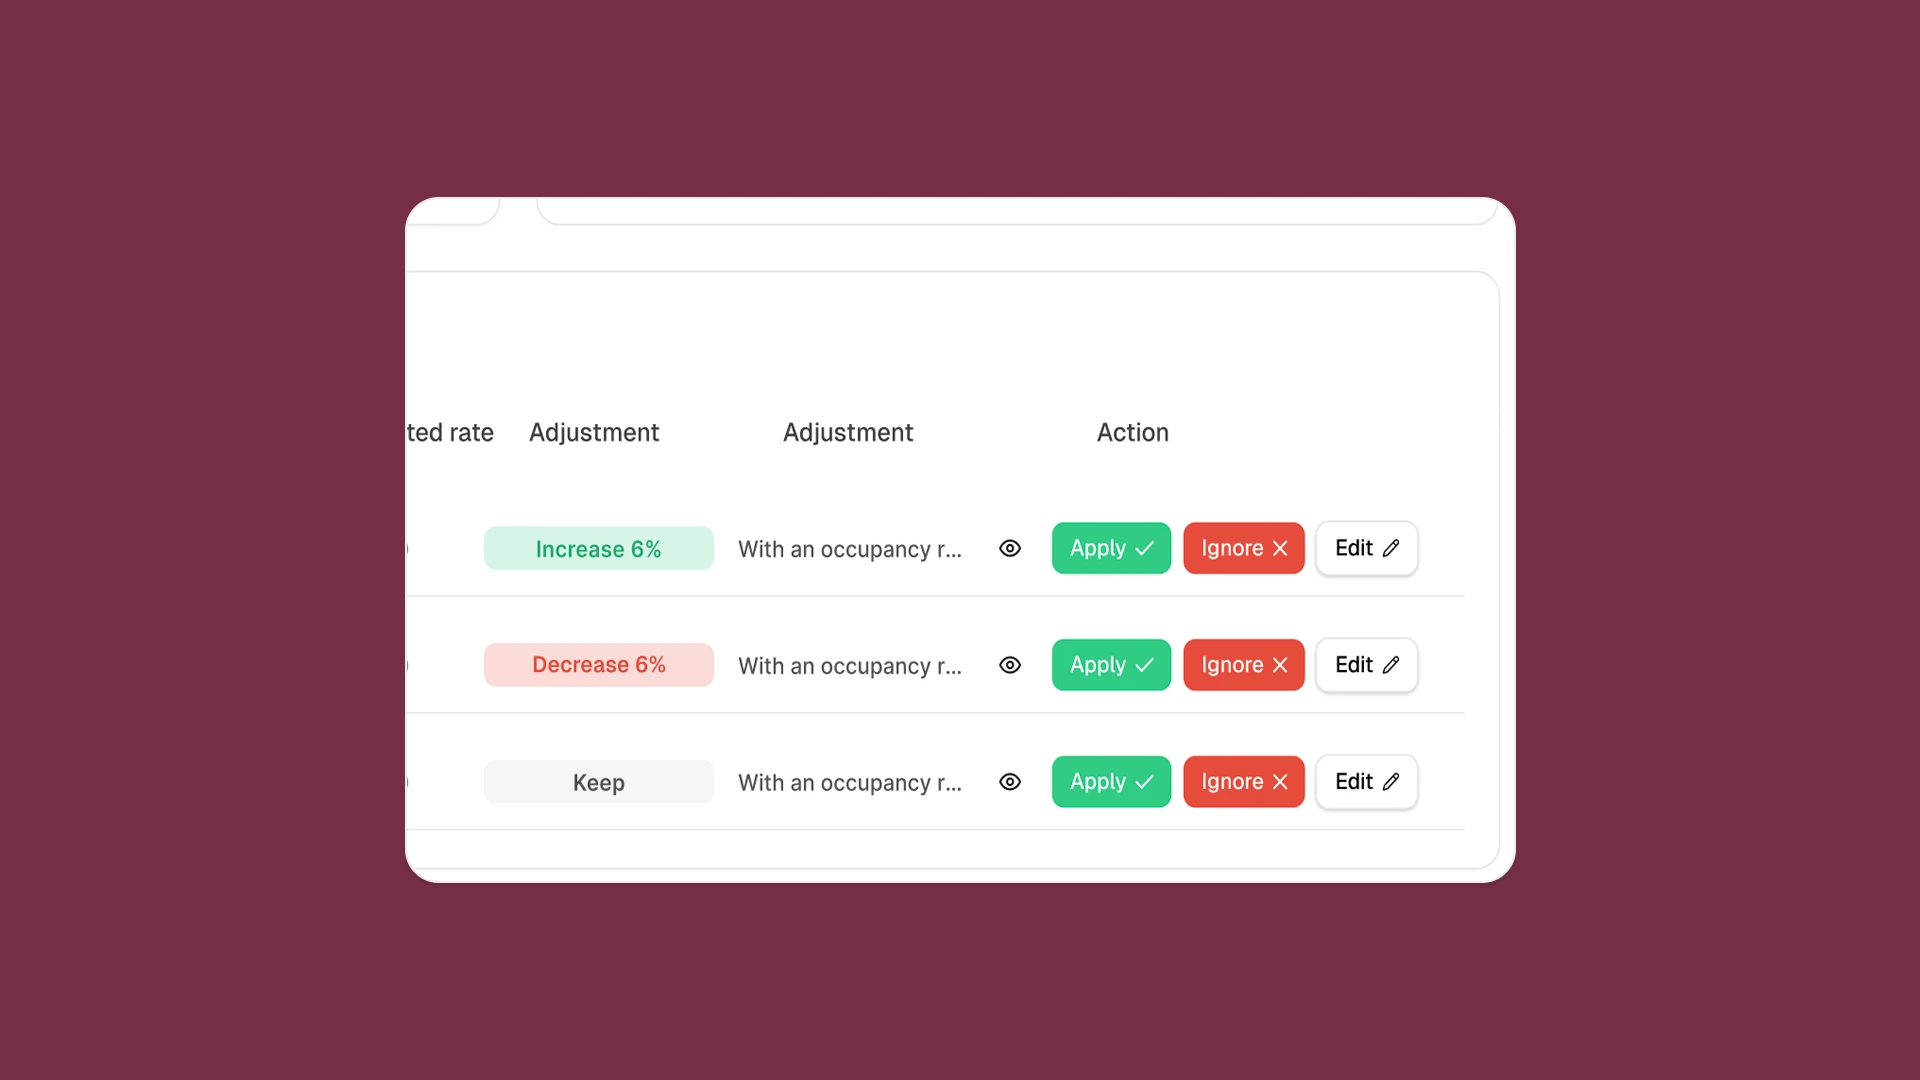
In the first high-fidelity design, we introduced AI recommendations alongside the three action buttons (Accept, Ignore, Edit). While this added intelligence, the card became visually saturated.
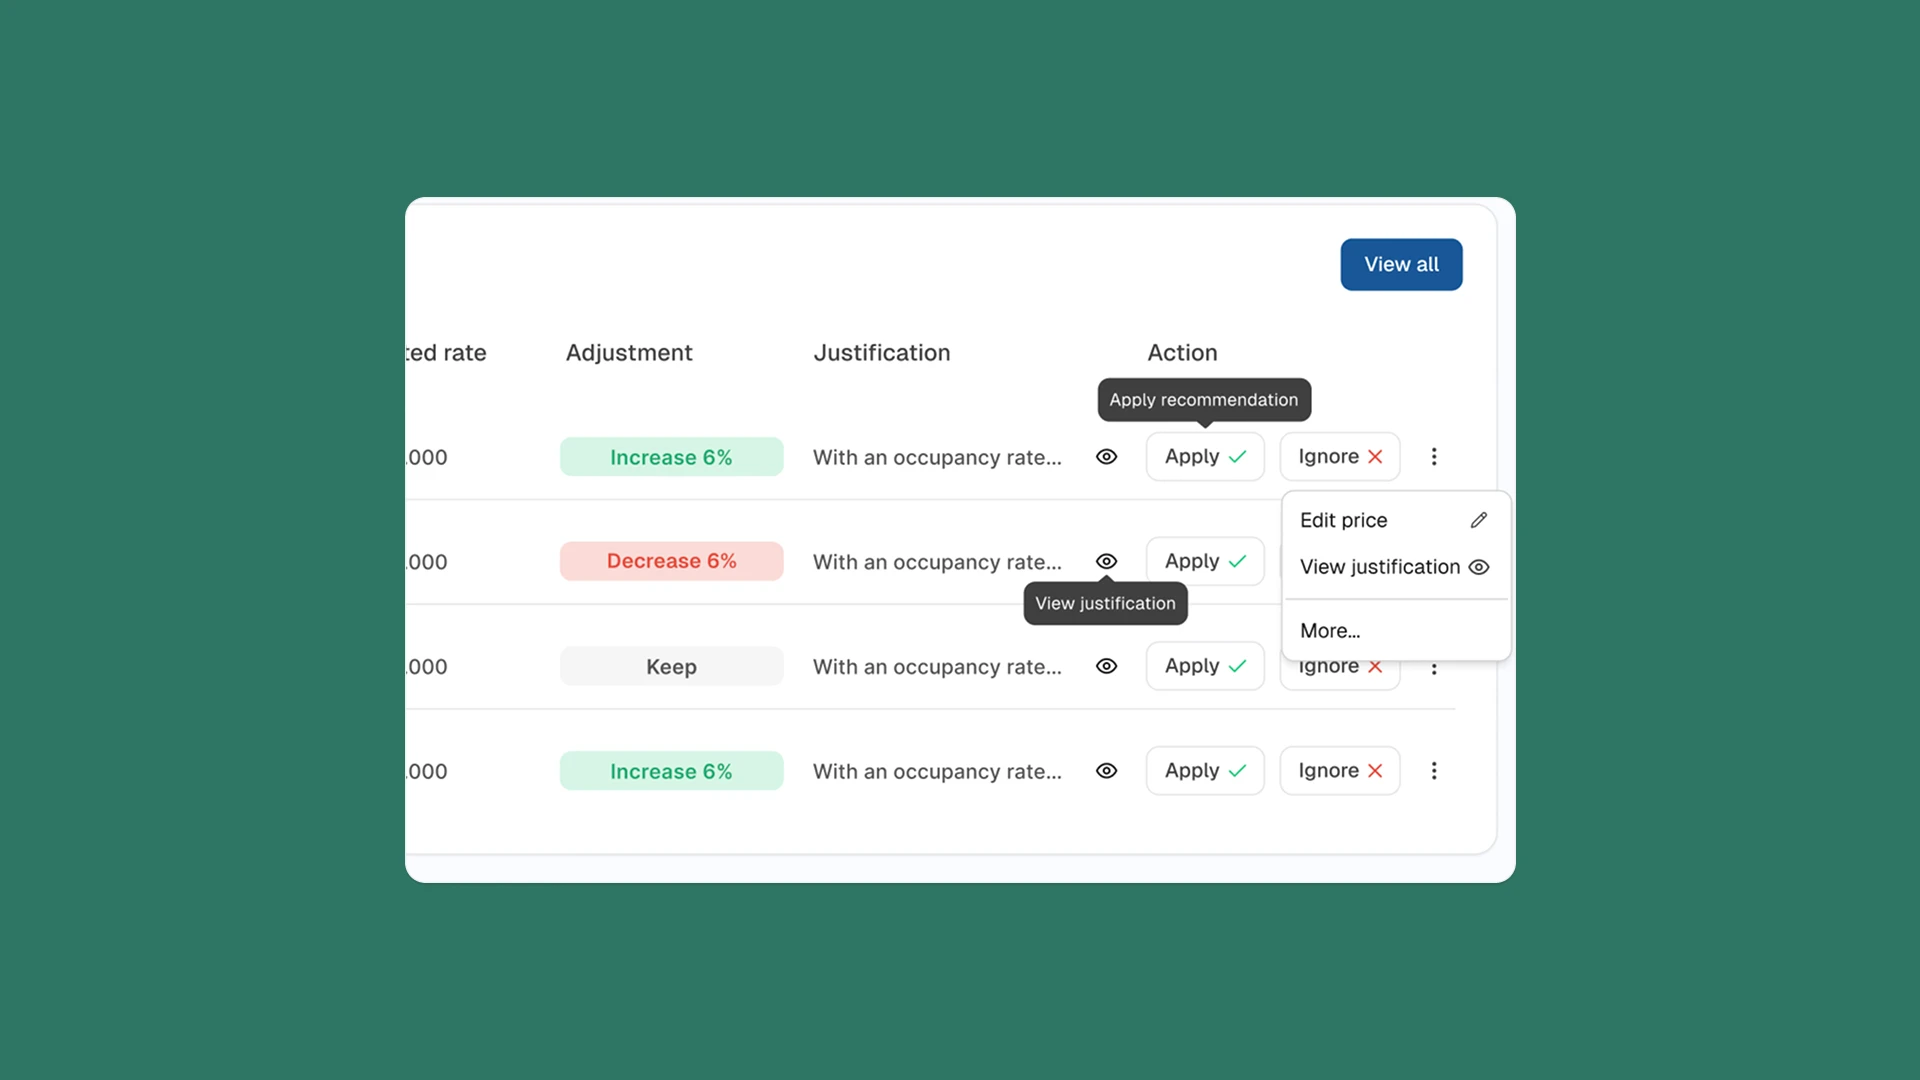
Final Design
After testing and reflection,
I simplified the interaction. The final card has a cleaner layout with fewer but clearer options, allowing managers to quickly understand the recommendation and act with confidence.
Web based MVP for optimizing pricing & reporting with AI.
In this project, I designed a responsive web app that helps hotel managers make smarter pricing decisions.
The tool integrates real-time competitor data, AI-generated recommendations, and intuitive dashboards turning complex revenue management into something clear, scalable and actionable.
The problem
Revenue managers spend up to 4 hours per hotel each week tracking competitor prices across 30 days, limiting updates to weekly. This makes it nearly impossible to scale beyond 2–3 hotels per day. Without dynamic pricing, hotels can lose 5–10% of potential revenue
The solution
We designed an AI Revenue web to centralize
and automate revenue management:
With Rebot, revenue managers reduced manual benchmarking from hours per hotel to an automated daily process. Instead of checking prices for only 2–3 hotels per day, they can now monitor 100+ hotels simultaneously, with AI scraping generated in <10 seconds. This efficiency unlocks up to 5–10% additional revenue through dynamic pricing.
Instead of hours in spreadsheets, managers now get insights to make instant decisions in one place.
Main Features
Traditional heatmaps are common tools for revenue managers, but they’re often overwhelming, packed with dense grids, endless rows of dates, and heavy colors. While they show a lot of data, they make it difficult to scan quickly or spot meaningful patterns.
Heatmap
Scraper
Revenue managers waste hours tracking competitors prices manually, so working with the dev-built scraper helped me understand how this tool could solve this problem for the user and translate it into a clear, actionable table.
The Design Process
I approached this project with a design thinking mindset, starting with real user pain points, validating needs quickly, and iterating fast. Along the way, I used AI as a partner to question assumptions, explore ideas, and speed up smaller decisions.
• Problem statement• Business goals
• Fast wireframes to validate ideas • AI-powered flows: scraping, PMS sync, smart pricing • Familiar UI for managers
• Iterated based on real feedback• Reduced visual noise• Clear hierarchy
• Dev team building the MVP• Internal testing in progress• Next step: test with real revenue managers!
Understand
Define
Ideate
Build & Iterate
Implement


Design Iterations
This example is one of the iterations that shows how the design evolved, starting simple in low-fi, testing actions in the first design, and refining into a clearer final version.
First Version
In the first high-fidelity design, we introduced AI recommendations alongside the three action buttons (Accept, Ignore, Edit). While this added intelligence, the card became visually saturated.
Final Design
After testing and reflection,
I simplified the interaction. The final card has a cleaner layout with fewer but clearer options, allowing managers to quickly understand the recommendation and act with confidence.
Role: Product Designer
Tools: Figma
Timeline: 4 weeks
Web based MVP for optimizing pricing & reporting with AI.
In this project, I designed a responsive web app that helps hotel managers make smarter pricing decisions.
The tool integrates real-time competitor data, AI-generated recommendations, and intuitive dashboards turning complex revenue management into something clear, scalable and actionable.
The problem
Revenue managers spend up to 4 hours per hotel each week tracking competitor prices across 30 days, limiting updates to weekly. This makes it nearly impossible to scale beyond 2–3 hotels per day. Without dynamic pricing, hotels can lose 5–10% of potential revenue
The solution
We designed an AI Revenue web to centralize and
automate revenue management:
With Rebot, revenue managers reduced manual benchmarking from hours per hotel to an automated daily process. Instead of checking prices for only 2–3 hotels per day, they can now monitor 100+ hotels simultaneously, with AI scraping generated in <10 seconds. This efficiency unlocks up to 5–10% additional revenue through dynamic pricing.
Instead of hours in spreadsheets, managers now get insights to make instant decisions in one place.
Main Features
Heatmap
Traditional heatmaps are common tools for revenue managers, but they’re often overwhelming, packed with dense grids, endless rows of dates, and heavy colors. While they show a lot of data, they make it difficult to scan quickly or spot meaningful patterns.
Scraper
Revenue managers waste hours tracking competitors prices manually, so working with the dev-built scraper helped me understand how this tool could solve this problem for the user and translate it into a clear, actionable table.
The Design Process
I approached this project with a design thinking mindset, starting with real user pain points, validating needs quickly, and iterating fast. Along the way, I used AI as a partner to question assumptions, explore ideas, and speed up smaller decisions.
• Problem statement• Business goals
• Fast wireframes to validate ideas • AI-powered flows: scraping, PMS sync, smart pricing • Familiar UI for managers
• Iterated based on real feedback• Reduced visual noise• Clear hierarchy
• Dev team building the MVP• Internal testing in progress• Next step: test with real revenue managers!
Understand
Define
Ideate
Build & Iterate
Implement


Design Iterations
This example is one of the iterations that shows how the design evolved, starting simple in low-fi, testing actions in the first design, and refining into a clearer final version.
First Version
In the first high-fidelity design, we introduced AI recommendations alongside the three action buttons (Accept, Ignore, Edit).
While this added intelligence, the card became visually saturated.
Final Design
After testing and reflection, I simplified the interaction. The final card has a cleaner layout with fewer but clearer options, allowing managers to quickly understand the recommendation and act with confidence.
