Rebot
Web based MVP for optimizing pricing & reporting with AI.
In this project, I designed a responsive web app that helps hotel managers make smarter pricing decisions.
The tool integrates real-time competitor data, AI-generated recommendations, and intuitive dashboards turning complex revenue management into something clear, scalable and actionable.
My role
Led research and high-fidelity design across product, brand, and website, supported by a scalable design system.
The team
I collaborated closely with a developer, using Figma Dev Mode and Cursor to keep the implementation aligned with the design system and interaction details.
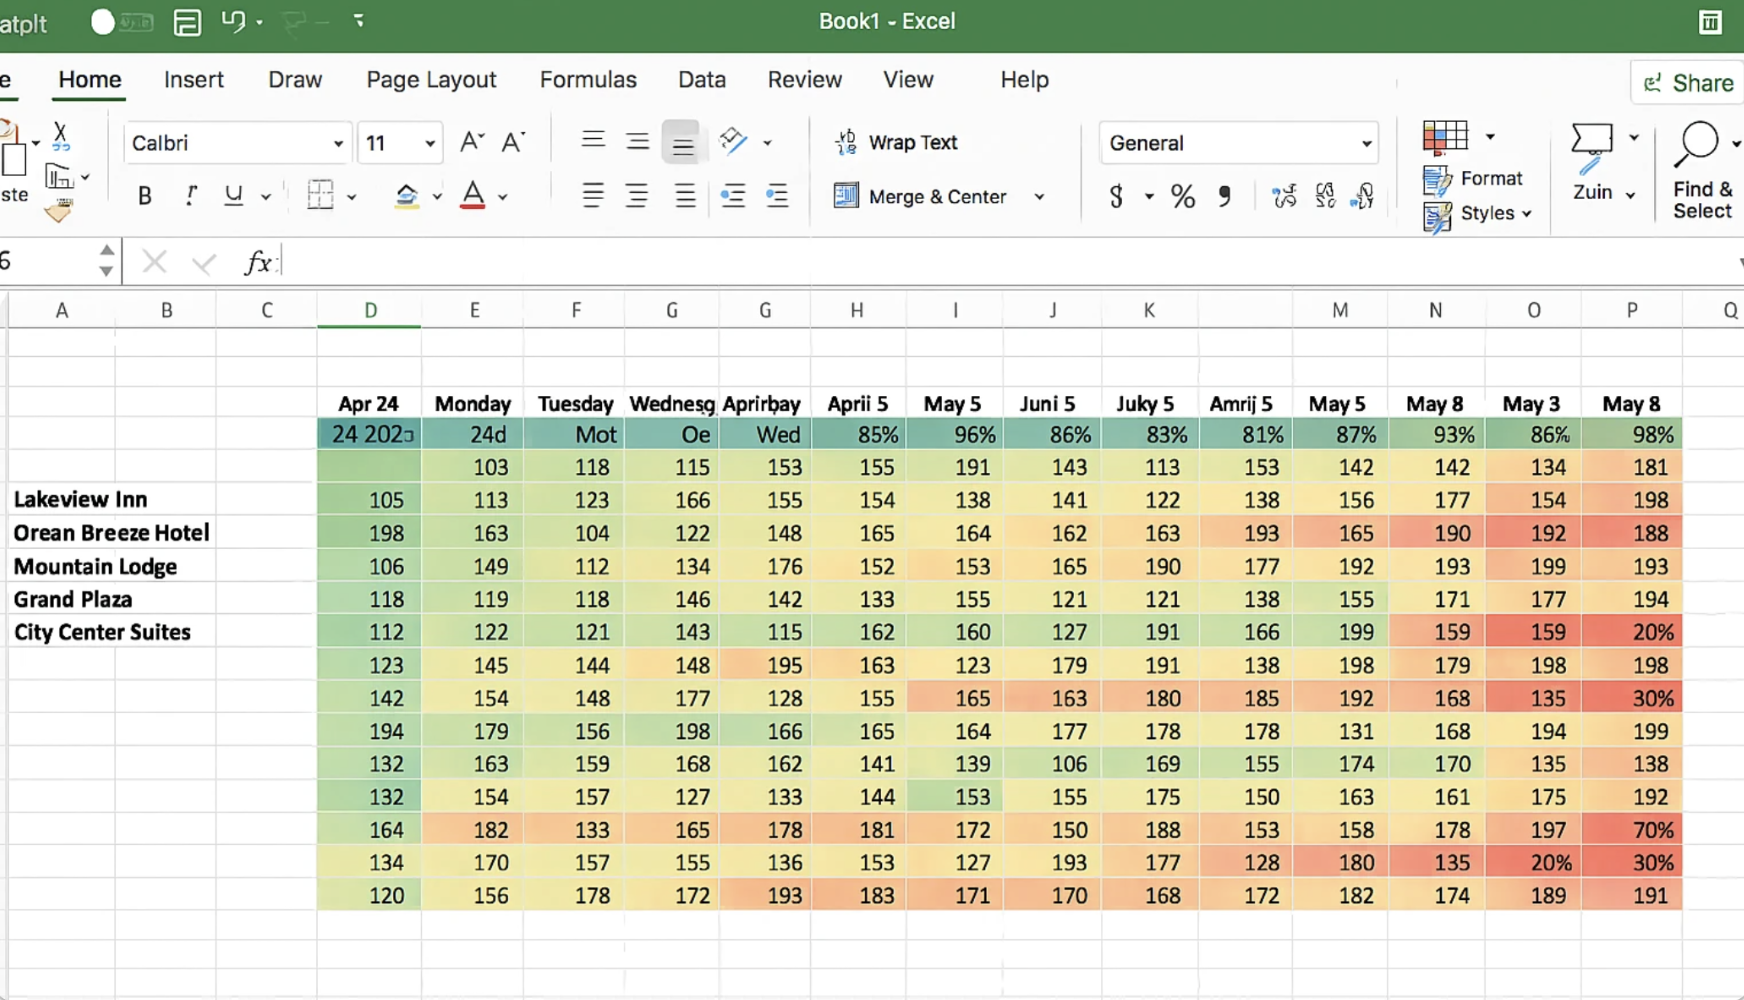
The problem
Hotels typically adjust room prices daily based on factors like demand, seasonality, occupancy, and competitor rates. This information comes from multiple data sources and is often reviewed in spreadsheets, tables, or traditional dashboards.
Because pricing decisions require comparing large volumes of data across many variables at once, revenue managers can spend up to 4 hours per hotel each week tracking competitor prices across 30 days. This often limits updates to a weekly cadence, makes it difficult to scale beyond 2–3 hotels per day, and can result in hotels losing 5–10% of potential revenue without dynamic pricing.
Rebot simplifies this workflow by turning complex pricing data into clear, visual patterns, enabling faster and more confident pricing decisions.
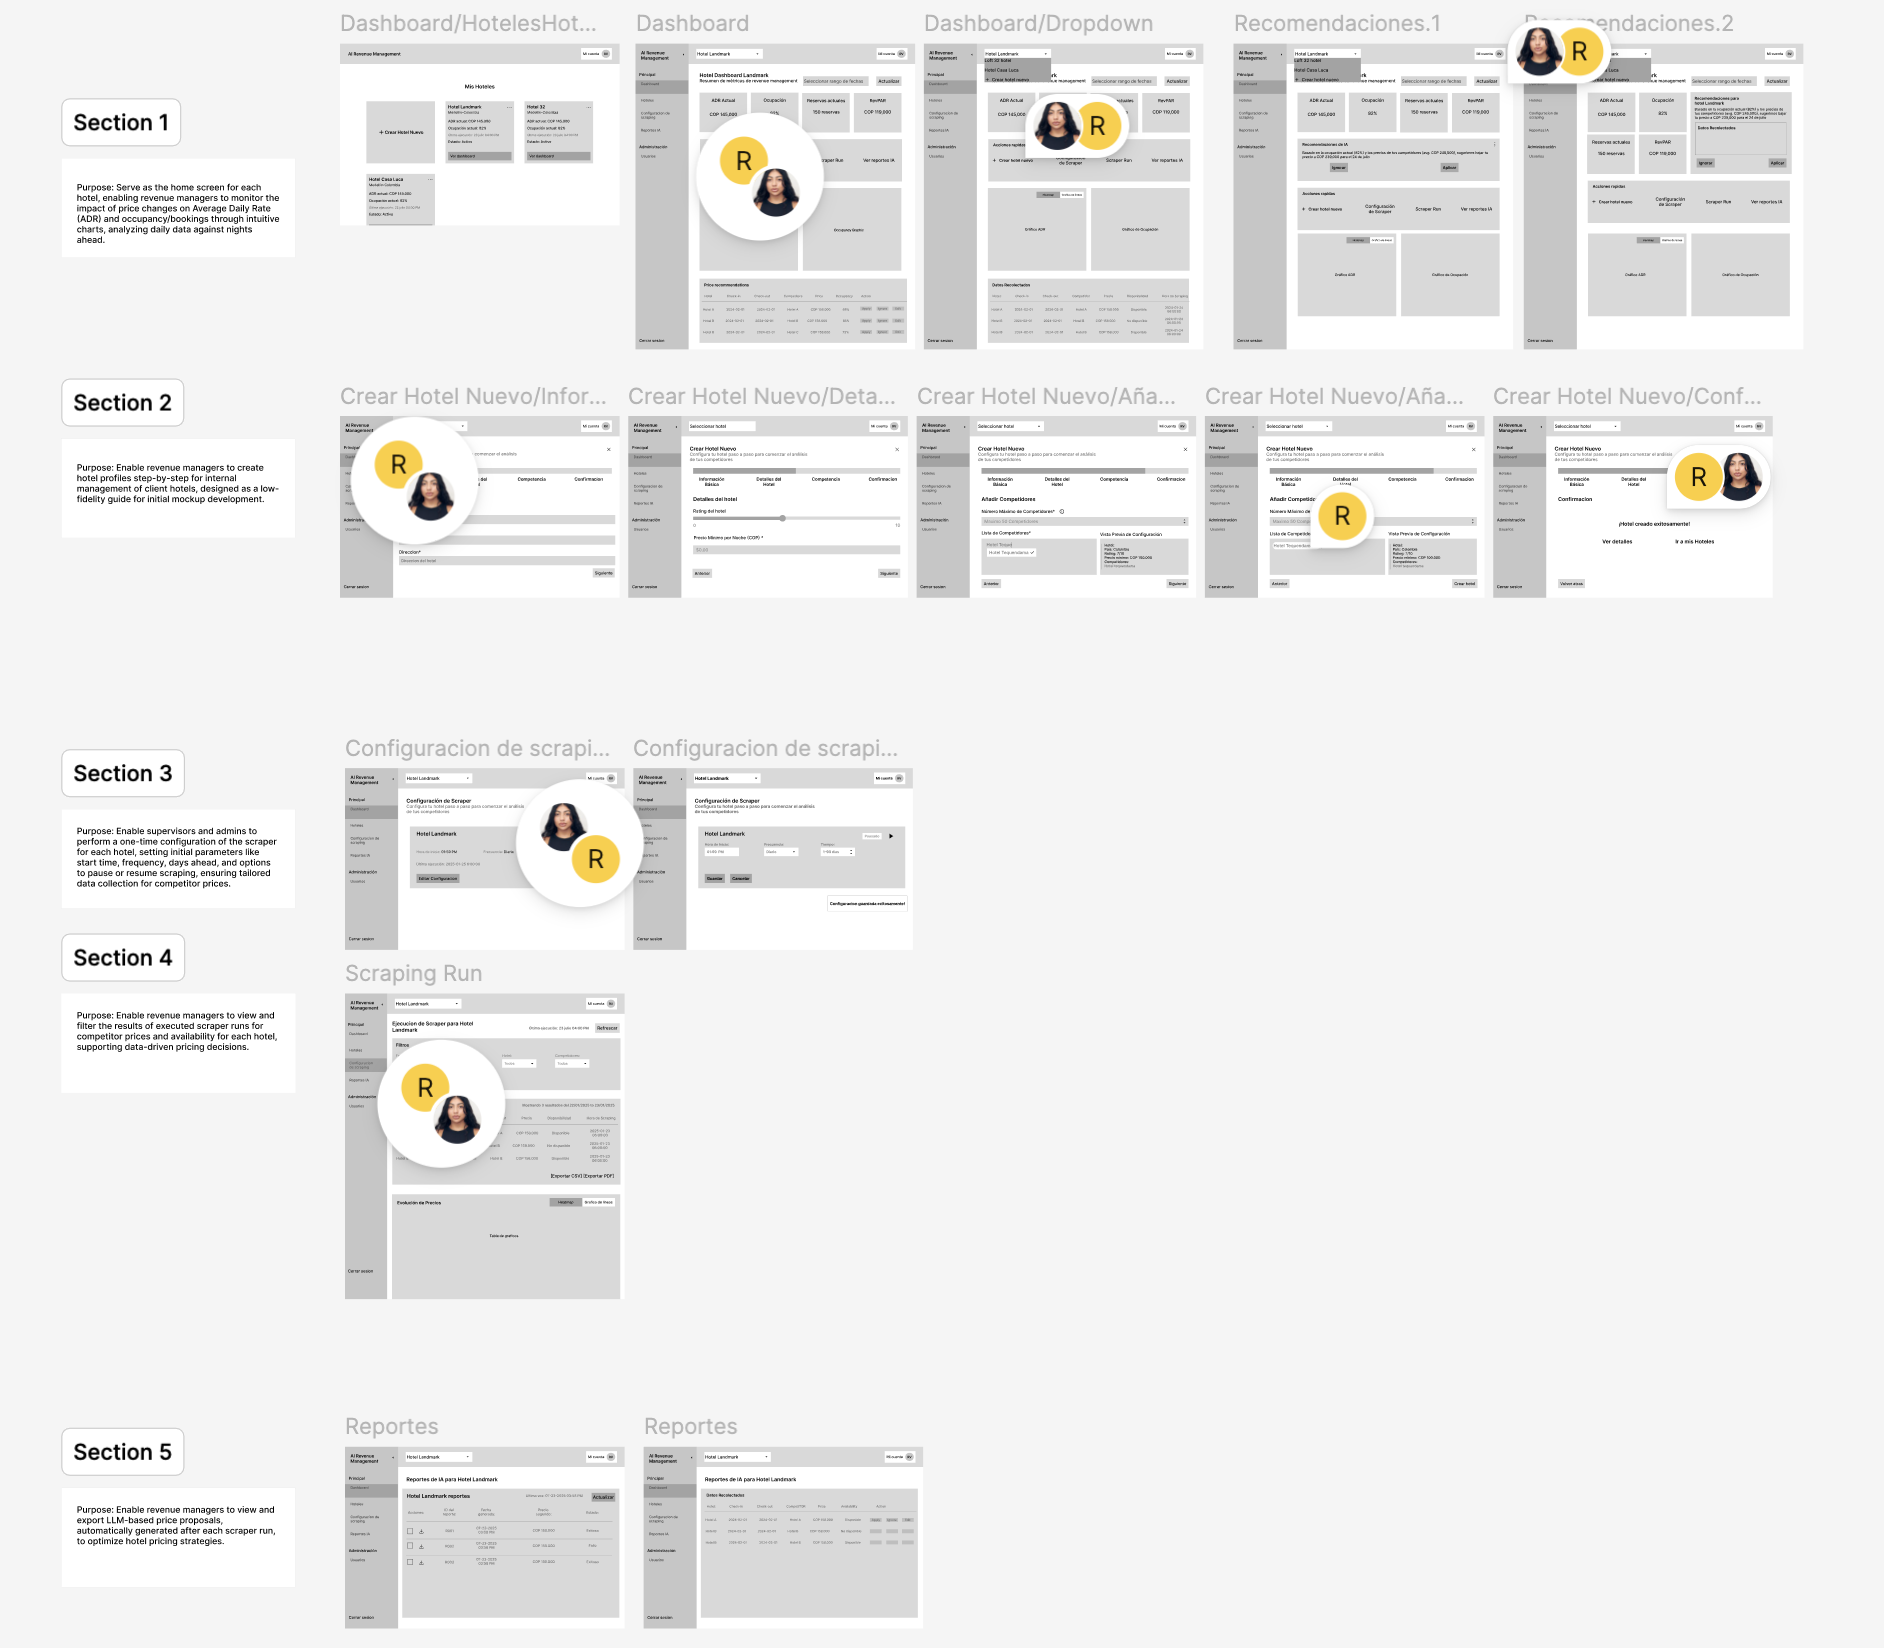
Exploring the Right Direction
I began by breaking down the revenue manager’s workflow into clear steps:
dashboard overview, hotel setup, competitor configuration, scraping execution, and reporting.
Early wireframes focused on structure and flow, defining how users move from setup to insights without friction.
What didn’t work
In the early versions, the focus was on making the scraper fully actionable by exposing a lot of data and configuration options. While this worked from a technical perspective, it didn’t always help users understand why a certain price was being suggested.
During usability sessions with two revenue managers, we saw that although they could access all the data, they often hesitated when it came time to act.
It wasn’t always clear:
Instead of empowering our users, the interface sometimes created uncertainty.

Refinement
User testing showed that the real challenge wasn’t accessing data, but feeling confident enough to act on it. The product was refined to prioritize clear, actionable decisions over raw data exposure.
By emphasizing recommendations, context, and visual hierarchy.
Rebot helps revenue managers understand what to do next and why, enabling faster and more confident pricing decisions.
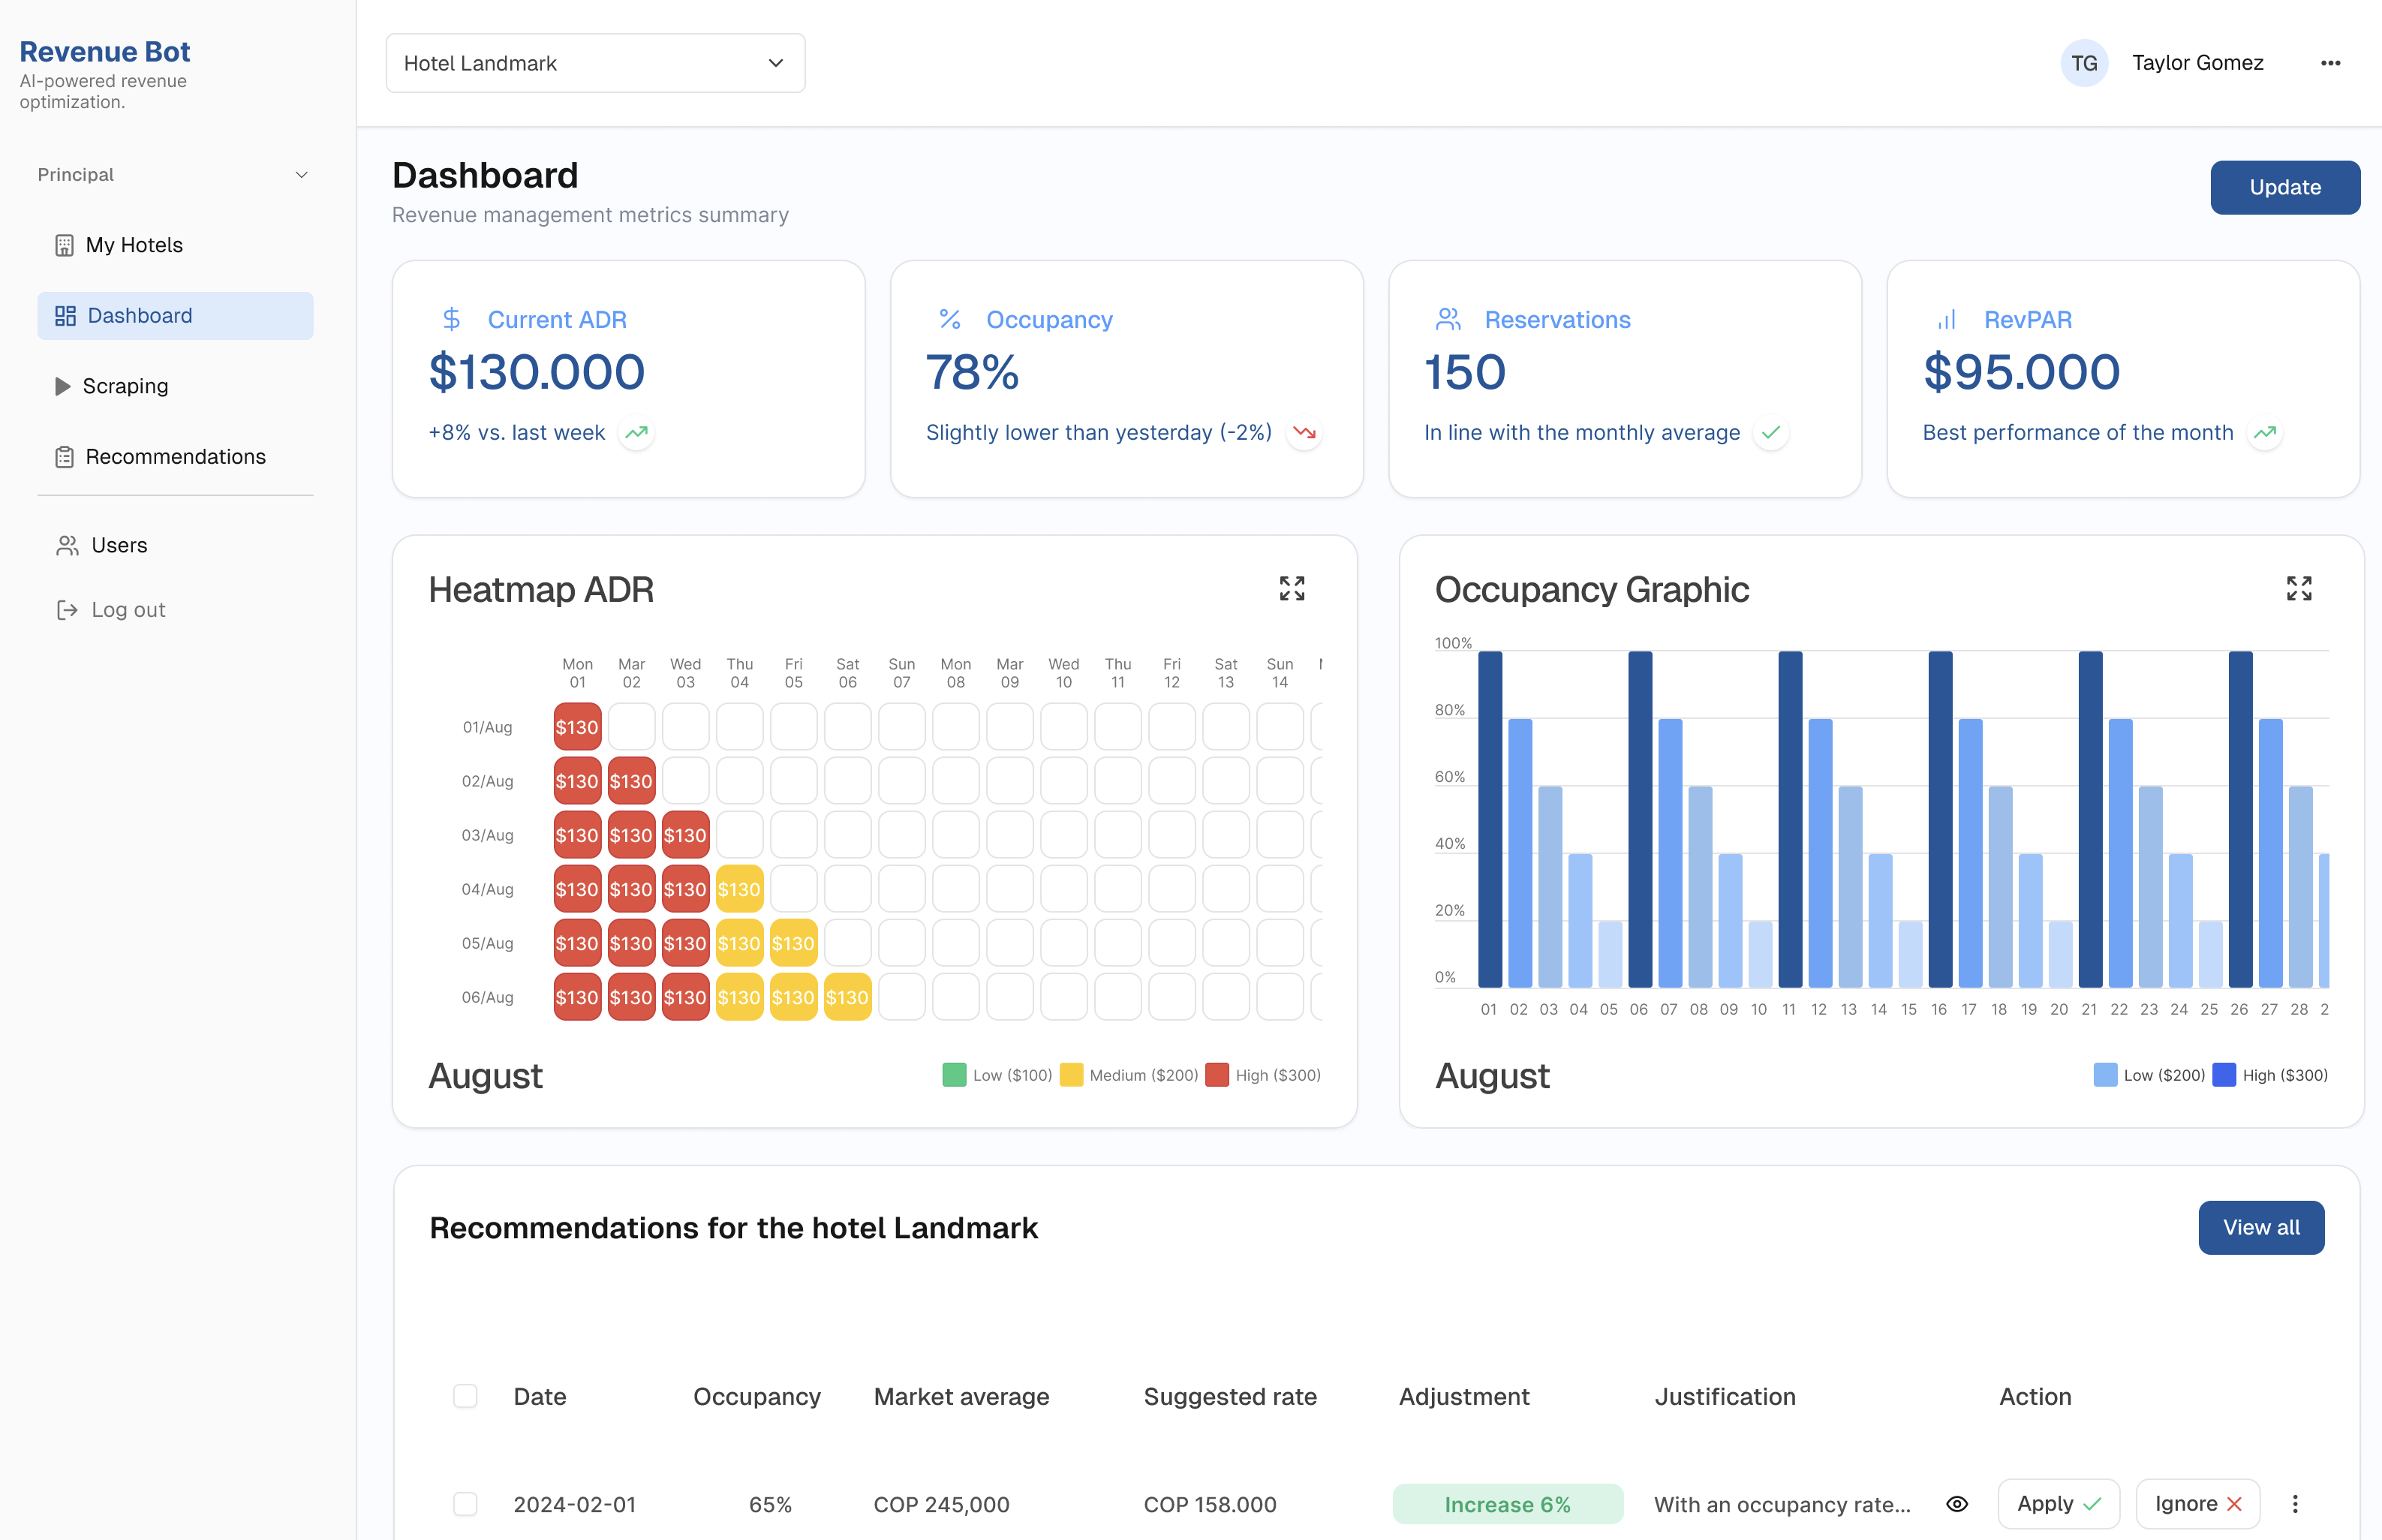
The solution
We designed an AI Revenue web to centralize and
automate revenue management:
With Rebot, revenue managers reduced manual benchmarking from hours per hotel to an automated daily process. Instead of checking prices for only 2–3 hotels per day, they can now monitor 100+ hotels simultaneously, with AI scraping generated in less than 10 seconds.
This efficiency unlocks up to 5–10% additional revenue through dynamic pricing.
Instead of hours in spreadsheets, managers now get insights to make instant decisions in one place.
Main Features
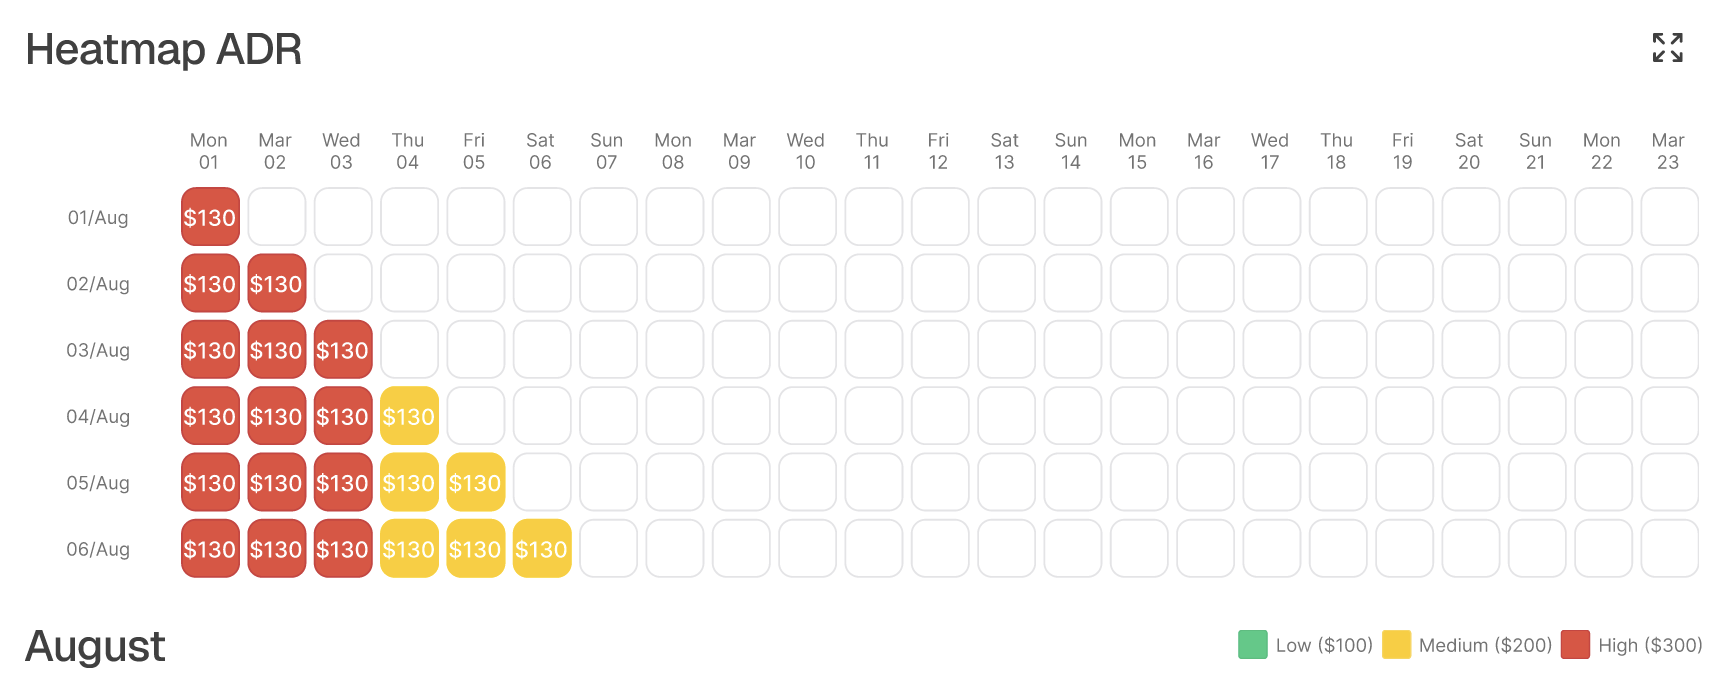
Heatmap
Traditional revenue heatmaps tend to be visually dense and hard to scan, making it difficult for revenue managers to quickly identify patterns or pricing opportunities.
For Rebot, I focused on clarity and fast decision-making.
I simplified the grid, reduced visual noise, and used clear, discrete color states to represent low, medium, and high ADR (Average Daily Rate)
ranges.
This allows users to understand performance at a glance, without needing to read every value.
The result is a heatmap designed for pattern recognition over data overload, helping users spot trends, anomalies, and pricing behavior faster.
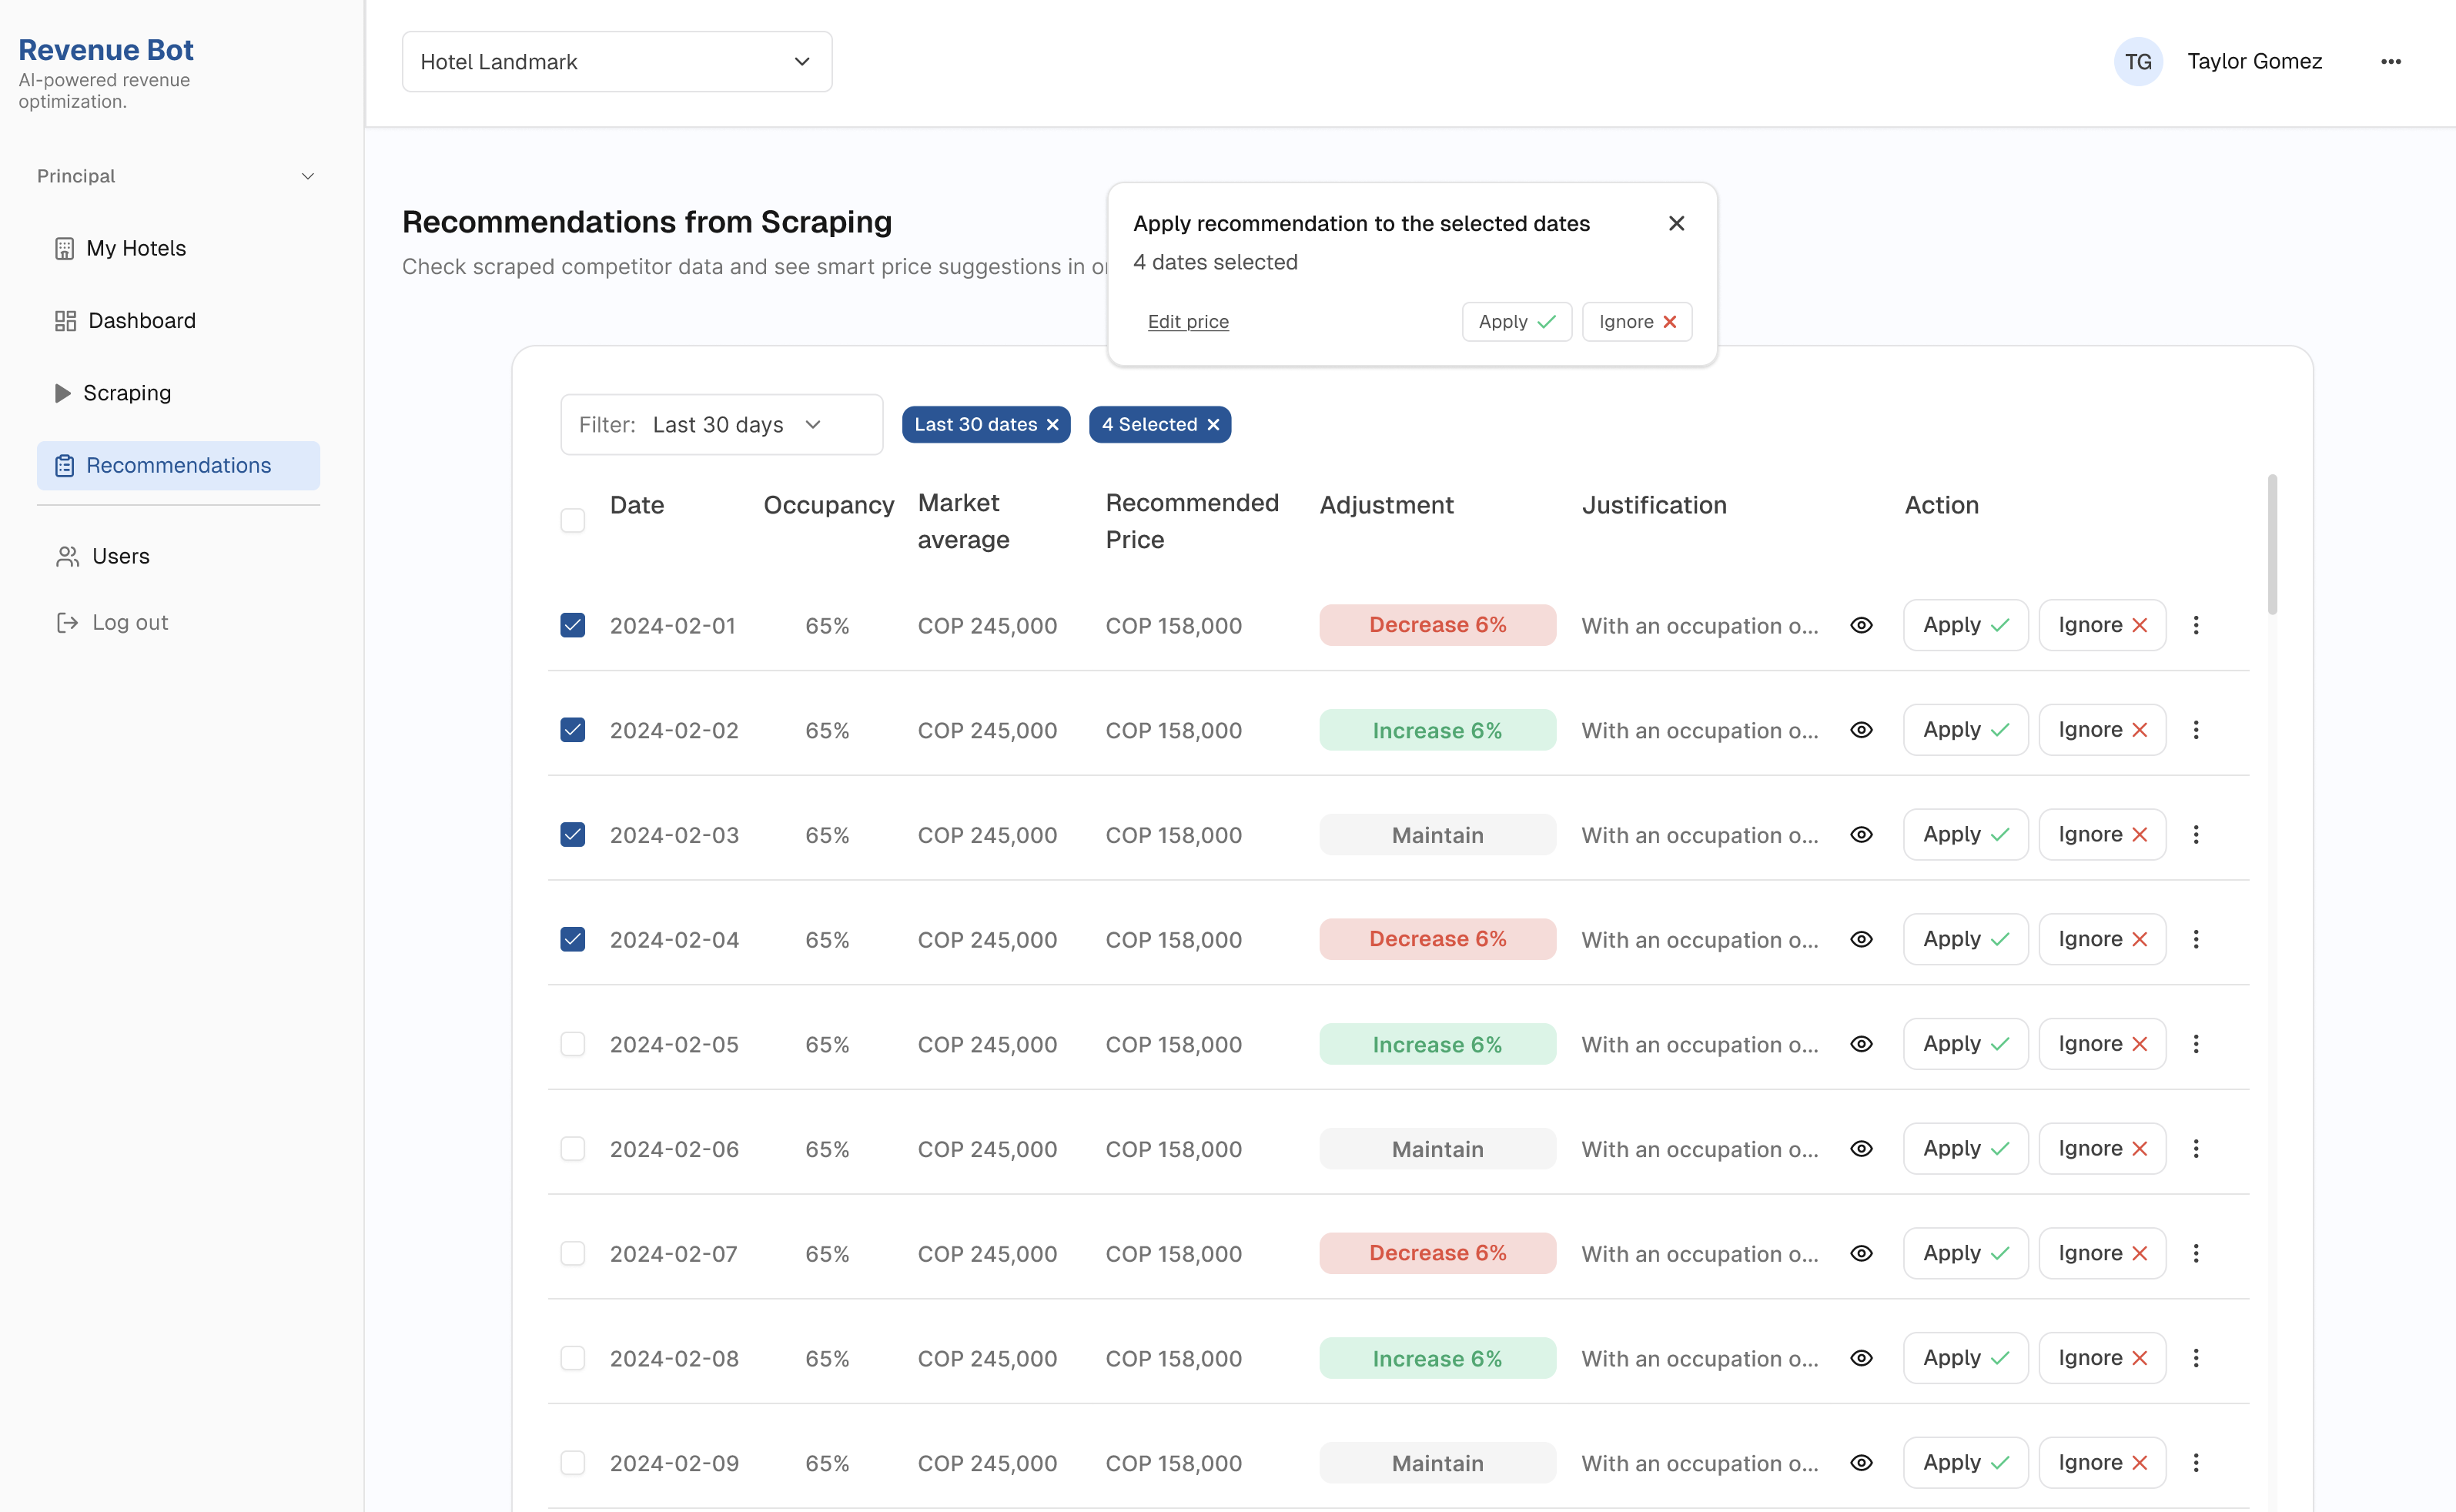
Scraper → Recommendations
Competitor prices are automatically scraped across the next 30 days and combined with each hotel’s context, such as occupancy and market averages.
Instead of showing raw data, the information is translated into clear pricing recommendations per date, highlighting:
Revenue managers can apply changes per date or in bulk, reducing manual work and enabling faster pricing decisions.
The Design Process
I approached this project with a design thinking mindset, starting with real user pain points, validating needs quickly, and iterating fast.
Along the way, I used AI as a partner to question assumptions, explore ideas, and speed up smaller decisions.
Understand
Define
• Problem statement• Business goals
Ideate
• Fast wireframes to validate ideas • AI-powered flows: scraping, PMS sync, smart pricing • Familiar UI for managers
Build & Iterate
• Iterated based on real feedback• Reduced visual noise• Clear hierarchy
Implement
• Dev team building the MVP• Internal testing in progress• Next step: test with real revenue managers!


Design Iterations
This example is one of the iterations that shows how the design evolved, starting simple in low-fi, testing actions in the first design, and refining into a clearer final version.
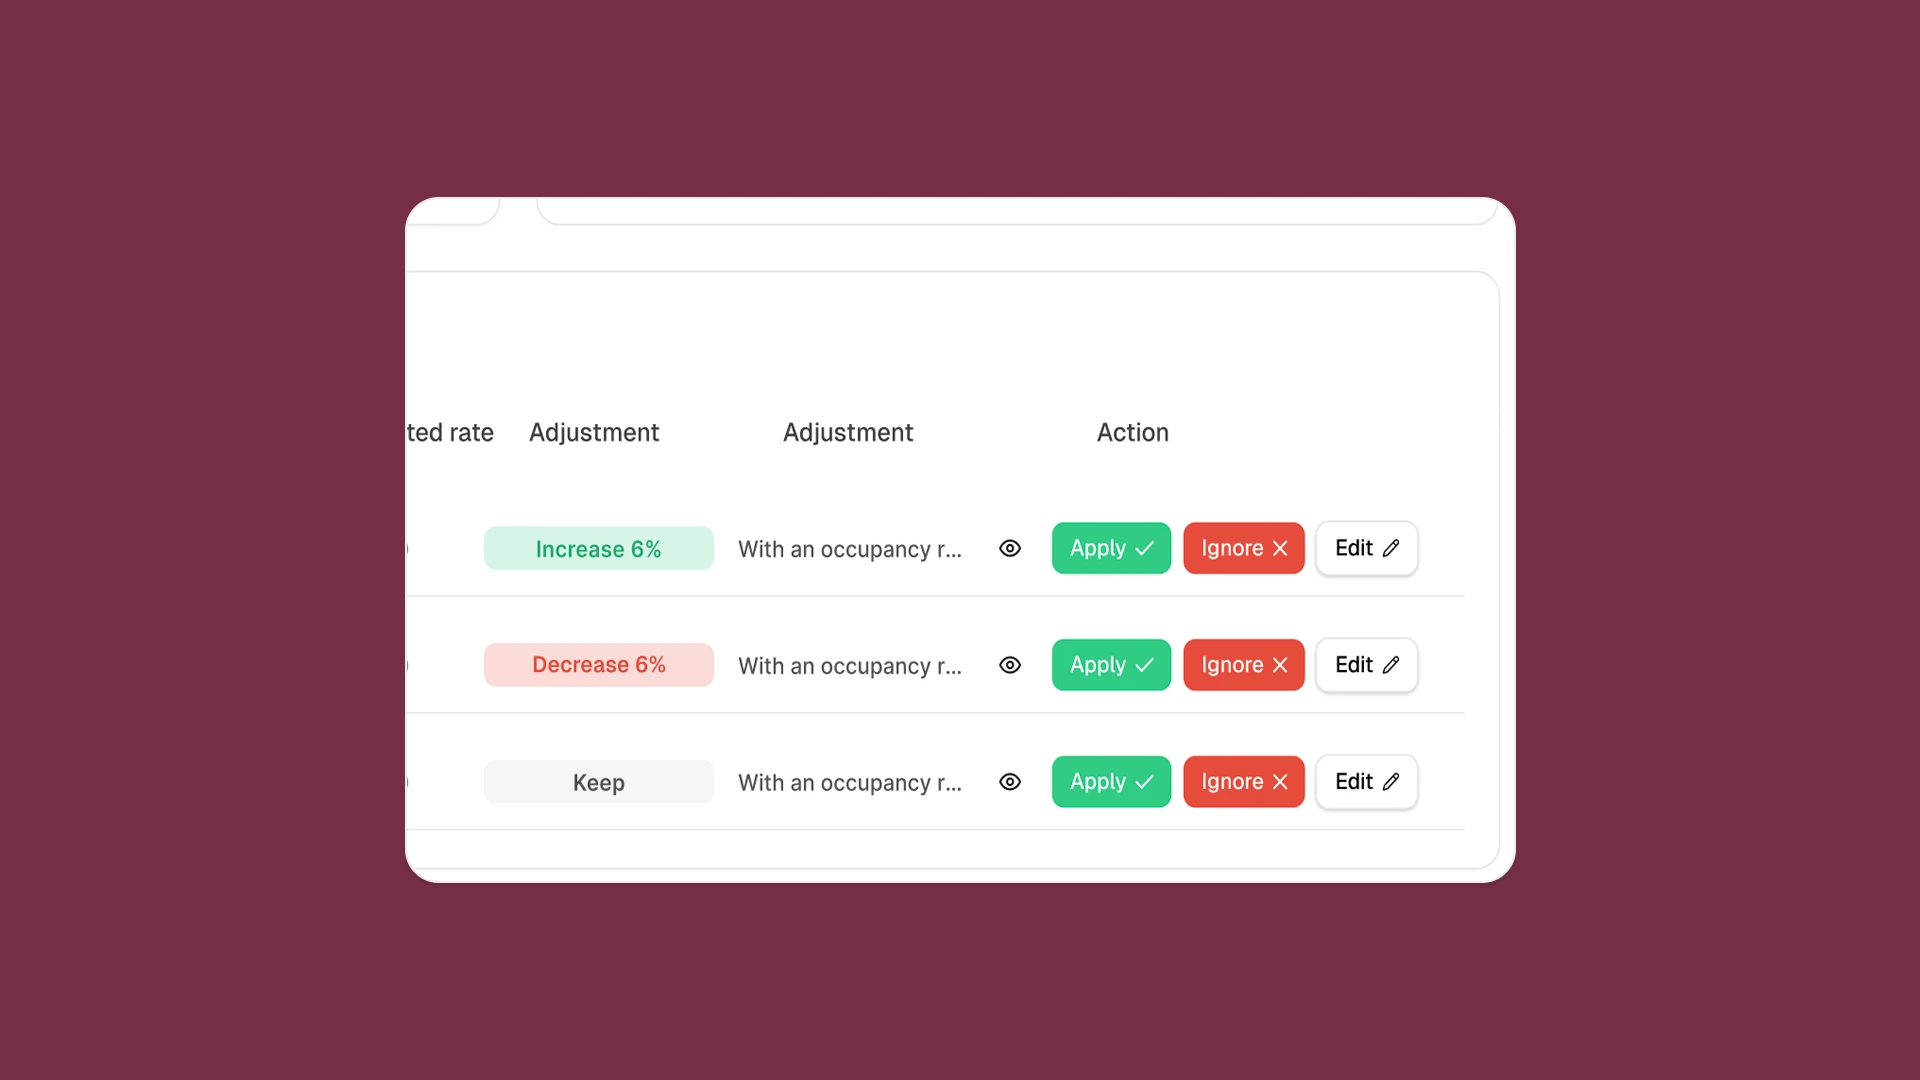
First Version
In the first high-fidelity design, we introduced AI recommendations alongside the three action buttons (Accept, Ignore, Edit).
While this added intelligence, the card became visually saturated.
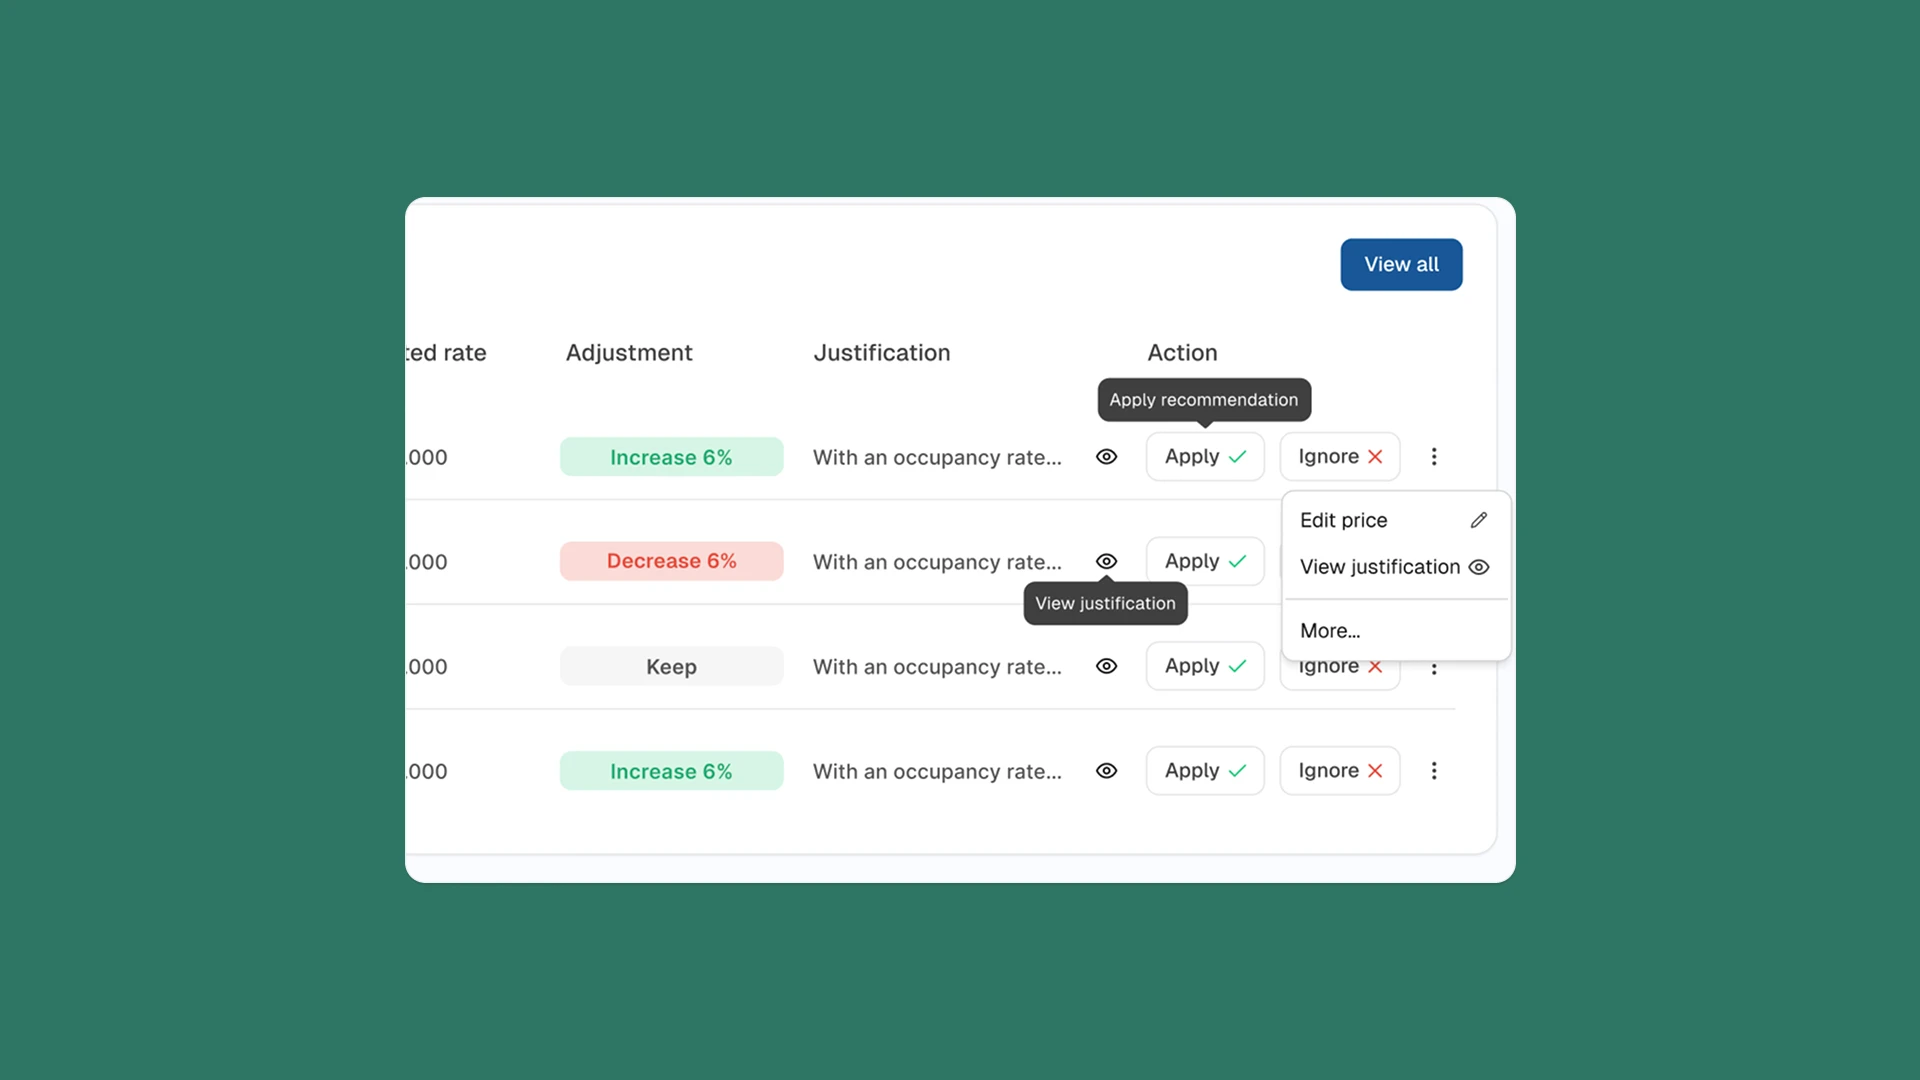
Final Design
After testing and reflection,
I simplified the interaction.
The final card has a cleaner layout with fewer but clearer options, allowing managers to quickly understand the recommendation and act with more
confidence.
Web based MVP for optimizing pricing & reporting with AI.
In this project, I designed a responsive web app that helps hotel managers make smarter pricing decisions.
The tool integrates real-time competitor data, AI-generated recommendations, and intuitive dashboards turning complex revenue management into something clear, scalable and actionable.
My role
Led research and high-fidelity design across product, brand, and website, supported by a scalable design system.
The team
I collaborated closely with a developer, using Figma Dev Mode and Cursor to keep the implementation aligned with the design system and interaction details.
The problem
Hotels typically adjust room prices daily based on factors like demand, seasonality, occupancy, and competitor rates. This information comes from multiple data sources and is often reviewed in spreadsheets, tables, or traditional dashboards.
Because pricing decisions require comparing large volumes of data across many variables at once, revenue managers can spend up to 4 hours per hotel each week tracking competitor prices across 30 days. This often limits updates to a weekly cadence, makes it difficult to scale beyond 2–3 hotels per day, and can result in hotels losing 5–10% of potential revenue without dynamic pricing.
Rebot simplifies this workflow by turning complex pricing data into clear, visual patterns, enabling faster and more confident pricing decisions.
Exploring the Right Direction
I began by breaking down the revenue manager’s workflow into clear steps:
dashboard overview, hotel setup, competitor configuration, scraping execution, and reporting.
Early wireframes focused on structure and flow, defining how users move from setup to insights without friction.
What didn’t work
In the early versions, the focus was on making the scraper fully actionable by exposing a lot of data and configuration options. While this worked from a technical perspective, it didn’t always help users understand why a certain price was being suggested.
During usability sessions with two revenue managers, we saw that although they could access all the data, they often hesitated when it came time to act.
It wasn’t always clear:
Instead of empowering our users, the interface sometimes created uncertainty.

Refinement
User testing showed that the real challenge wasn’t accessing data, but feeling confident enough to act on it. The product was refined to prioritize clear, actionable decisions over raw data exposure.
By emphasizing recommendations, context, and visual hierarchy.
Rebot helps revenue managers understand what to do next and why, enabling faster and more confident pricing decisions.
The solution
We designed an AI Revenue web to centralize
and automate revenue management:
With Rebot, revenue managers reduced manual benchmarking from hours per hotel to an automated daily process. Instead of checking prices for only 2–3 hotels per day, they can now monitor 100+ hotels simultaneously, with AI scraping generated in less than 10 seconds.
This efficiency unlocks up to 5–10% additional revenue through dynamic pricing.
Instead of hours in spreadsheets, managers now get insights to make instant decisions in one place.
Main Features
Heatmap
Traditional revenue heatmaps tend to be visually dense and hard to scan, making it difficult for revenue managers to quickly identify patterns or pricing opportunities.
For Rebot, I focused on clarity and fast decision-making.
I simplified the grid, reduced visual noise, and used clear, discrete color states to represent low, medium, and high ADR (Average Daily Rate) ranges.
This allows users to understand performance at a glance, without needing to read every value.
The result is a heatmap designed for pattern recognition over data overload, helping users spot trends, anomalies, and pricing behavior faster.
Scraper → Recommendations
Competitor prices are automatically scraped across the next 30 days and combined with each hotel’s context, such as occupancy and market averages.
Instead of showing raw data, the information is translated into clear pricing recommendations per date, highlighting:
Revenue managers can apply changes per date or in bulk, reducing manual work and enabling faster pricing decisions.
The Design Process
I approached this project with a design thinking mindset, starting with real user pain points, validating needs quickly, and iterating fast. Along the way, I used AI as a partner to question assumptions, explore ideas, and speed up smaller decisions.
• Problem statement• Business goals
• Fast wireframes to validate ideas • AI-powered flows: scraping, PMS sync, smart pricing • Familiar UI for managers
• Iterated based on real feedback• Reduced visual noise• Clear hierarchy
• Dev team building the MVP• Internal testing in progress• Next step: test with real revenue managers!
Understand
Define
Ideate
Build & Iterate
Implement


Design Iterations
This example is one of the iterations that shows how the design evolved, starting simple in low-fi, testing actions in the first design, and refining into a clearer final version.
First Version
In the first high-fidelity design, we introduced AI recommendations alongside the three action buttons (Accept, Ignore, Edit).
While this added intelligence, the card became visually saturated.
Final Design
After testing and reflection, I simplified the interaction.
The final card has a cleaner layout with fewer but clearer options, allowing managers to quickly understand the recommendation and act with more confidence.
Role: Product Designer
Tools: Figma
Timeline: 4 weeks
Web based MVP for optimizing pricing & reporting with AI.
In this project, I designed a responsive web app that helps hotel managers make smarter pricing decisions.
The tool integrates real-time competitor data, AI-generated recommendations, and intuitive dashboards turning complex revenue management into something clear, scalable and actionable.
My role
Product Designer, responsible for end-to-end UX/UI design, from problem definition to high-fidelity visuals.
The team
Worked closely with the founder/product lead and engineering to balance business logic, technical constraints, and usability.
The problem
Hotels typically adjust room prices daily based on factors like demand, seasonality, occupancy, and competitor rates. This information comes from multiple data sources and is often reviewed in spreadsheets, tables, or traditional dashboards.
Because pricing decisions require comparing large volumes of data across many variables at once,
revenue managers can spend up to 4 hours per hotel each week tracking competitor prices across 30 days.
This often limits updates to a weekly cadence, makes it difficult to scale beyond 2–3 hotels per day, and can result in hotels losing 5–10% of potential revenue without dynamic pricing.
Rebot simplifies this workflow by turning complex pricing data into clear, visual patterns, enabling faster and more confident pricing decisions.
Exploring the Right Direction
I began by breaking down the revenue manager’s workflow into clear steps:
dashboard overview, hotel setup, competitor configuration, scraping execution, and reporting.
Early wireframes focused on structure and flow, defining how users move from setup to insights without friction.
What didn’t work
In the early versions, the focus was on making the scraper fully actionable by exposing a lot of data and configuration options. While this worked from a technical perspective, it didn’t always help users understand why a certain price was being suggested.
During usability sessions with two revenue managers, we saw that although they could access all the data, they often hesitated when it came time to act.
It wasn’t always clear:
Instead of empowering our users, the interface sometimes created uncertainty.

Refinement
User testing showed that the real challenge wasn’t accessing data, but feeling confident enough to act on it. The product was refined to prioritize clear, actionable decisions over raw data exposure.
By emphasizing recommendations, context, and visual hierarchy.
Rebot helps revenue managers understand what to do next and why, enabling faster and more confident pricing decisions.
The solution
We designed an AI Revenue web to centralize and
automate revenue management:
With Rebot, revenue managers reduced manual benchmarking from hours per hotel to an automated daily process. Instead of checking prices for only 2–3 hotels per day, they can now monitor 100+ hotels simultaneously, with AI scraping generated in less than 10 seconds.
This efficiency unlocks up to 5–10% additional revenue through dynamic pricing.
Instead of hours in spreadsheets, managers now get insights to make instant decisions in one place.
Main Features
Heatmap
Traditional revenue heatmaps tend to be visually dense and hard to scan, making it difficult for revenue managers to quickly identify patterns or pricing opportunities.
For Rebot, I focused on clarity and fast decision-making.
I simplified the grid, reduced visual noise, and used clear, discrete color states to represent low, medium, and high ADR (Average Daily Rate) ranges.
This allows users to understand performance at a glance, without needing to read every value.
The result is a heatmap designed for pattern recognition over data overload, helping users spot trends, anomalies, and pricing behavior faster.
Scraper → Recommendations
Competitor prices are automatically scraped across the next 30 days and combined with each hotel’s context, such as occupancy and market averages.
Instead of showing raw data, the information is translated into clear pricing recommendations per date, highlighting:
Revenue managers can apply changes per date or in bulk, reducing manual work and enabling faster pricing decisions.
The Design Process
I approached this project with a design thinking mindset, starting with real user pain points, validating needs quickly, and iterating fast. Along the way, I used AI as a partner to question assumptions, explore ideas, and speed up smaller decisions.
• Problem statement• Business goals
• Fast wireframes to validate ideas • AI-powered flows: scraping, PMS sync, smart pricing • Familiar UI for managers
• Iterated based on real feedback• Reduced visual noise• Clear hierarchy
• Dev team building the MVP• Internal testing in progress• Next step: test with real revenue managers!
Understand
Define
Ideate
Build & Iterate
Implement


Design Iterations
This example is one of the iterations that shows how the design evolved, starting simple in low-fi, testing actions in the first design, and refining into a clearer final version.
First Version
In the first high-fidelity design, we introduced AI recommendations alongside the three action buttons (Accept, Ignore, Edit).
While this added intelligence, the card became visually saturated.
Final Design
After testing and reflection, I simplified the interaction.
The final card has a cleaner layout with fewer but clearer options, allowing managers to quickly understand the recommendation and act with more confidence.
